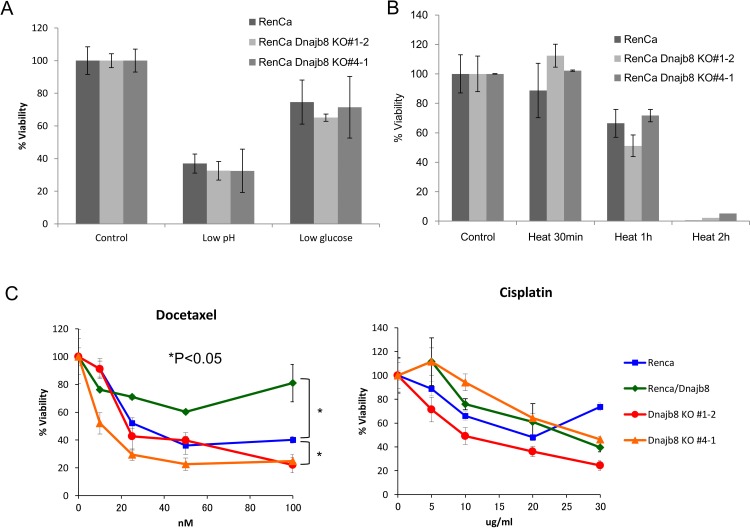
Fig 4. Analysis of stress response.
(A) Low pH stress and low glucose stress. Ten thousand cells were cultured for 5 days and the number of cells was counted. Data represent the percent of alive cell rates compared with control groups. (B) Responses to heat shock stresses. Ten thousand cells were cultured for 5 days after heat shock stress, and the number of cells was counted. Data represent the percent of alive cell rates compared with control groups. (C) Chemo-resistance. Eight thousand cells were cultured for 4 days in chemotherapeutic reagents (Docetaxel or Cisplatin). The percentage of viability were addressed using WST-8 reagents. Data are shown as means ± SD. Differences between groups were examined for statistical significance by Student's t-test.

