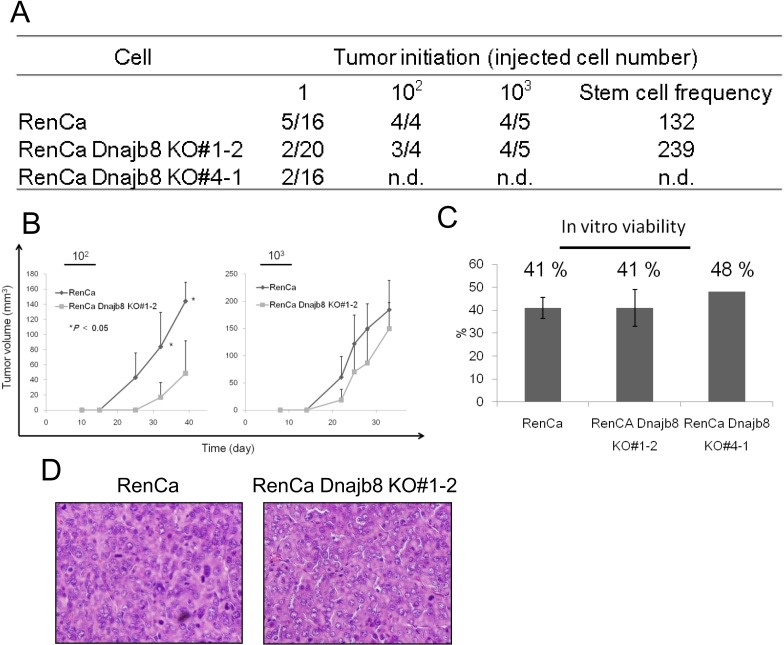
Fig 5. In vivo analysis of stemness.
(A) Summary of tumor initiation. Tumor-initiating abilities were evaluated at day 33 after injection of 103 cells, at day 39 after injection of 102 cells and at day 70 after injection of single cells. (B) Tumor growth curves of WT and Dnajb8 KO cells. Cells were inoculated subcutaneously into the backs of five Balb/c mice and tumor growth was measured weekly. Data represent means ± SD. The difference between wild RenCa cells and two KO RenCa cells was examined for statistical significance using Student’s t-test. (C) Compensated tumor initiation rate for single cell injection. Data was obtained by calculation with alive cell rates in vitro culture. (D) Histological photos of tumors derived from WT cells and Dnajb8 KO cells. Magnification, × 200.

