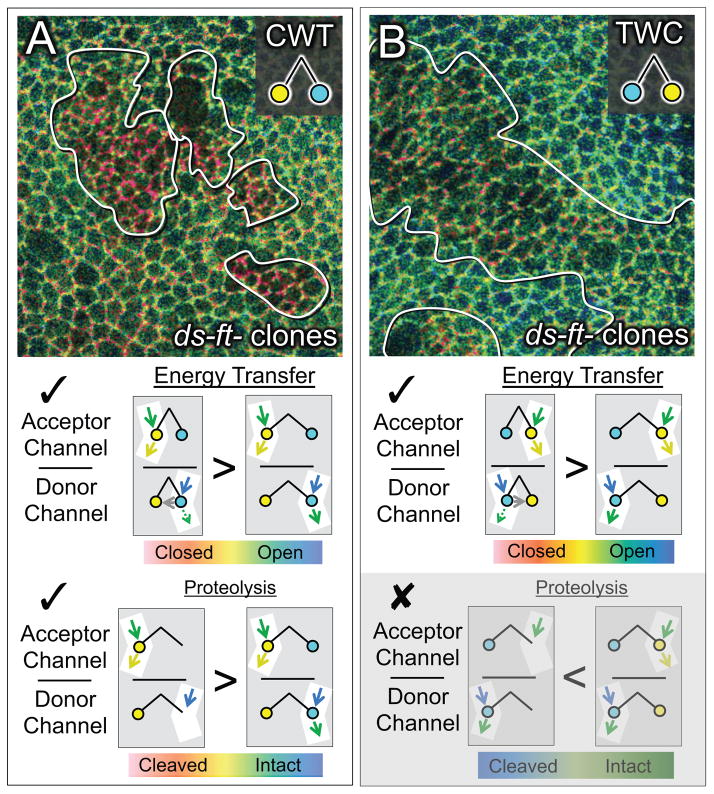
Figure 3. ds−ft− cells show increased Wts in the “closed” conformational state.
A) Q ratio image of wing tissue expressing the CWT sensor and containing clones of ds−ft− cells (outlined; Q ratio scale as in Fig. 2). Clones appear red relative to the wildtype surround. See Fig. S3 for Q ratio images of tissue containing single mutant ds− and ft− clones, and Fig. S4 for further examples and documentation of Q ratios and CWT abundance associated with ds−ft− cells relative to surrounding wildtype cells.
As diagrammed underneath, Q (the ratio of acceptor and donor channel emissions) is expected to rise (
 ) if the mutant condition causes an increase in either energy transfer or C-terminal proteolysis.
B) Q ratio image for ds−ft− clones in wing tissue expressing the TWC sensor. As in A, clones appear red relative to the surround, as expected if energy transfer increases in the mutant cells (
 ). However, clones should appear blue in the case of C-terminal proteolysis, which was not observed (
 ; greyed out). Note that the difference between the clone and surround is less pronounced for the TWC than the CWT sensor (A), possibly reflecting a less favorable dipole orientation of the two fluorophores in the TWC sensor.

