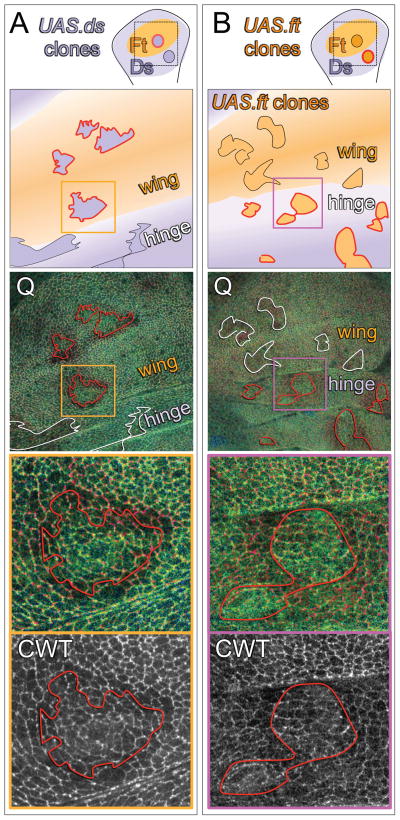
Figure 4. Ft/Ds signaling regulates the conformational state of Wts.
A, B) Wing discs containing UAS.ds (A) or UAS.ft (B) over-expressing clones. As in the cartoons, the wing and hinge primordia are shaded orange and purple, respectively, to indicate that they comprise predominately Ft or Ds signaling cell populations, and the clones are shown as darker orange or purple to indicate the over-expression of Ft or Ds protein. Clone borders that create abrupt, ectopic confrontations between Ft and Ds signaling cells are outlined in red, and those that do not, are outlined in black (cartoons) or white (Q ratio images; Q ratio scale as in Fig. 2). UAS.ds clones (A) induce an increase in Q in surrounding wildtype cells (appear red) when located in the wing, but not in the hinge. Conversely, UAS.ft clones (B) induce an increase in Q when located in the hinge, but not in the wing. Q ratio and CWT (acceptor channel) images of the regions boxed in orange and purple in the middle panels are shown at higher magnification in the bottom panels: clones that create abrupt, ectopic signaling interfaces induce higher Q values in wildtype cells up to four cell diameters away.

