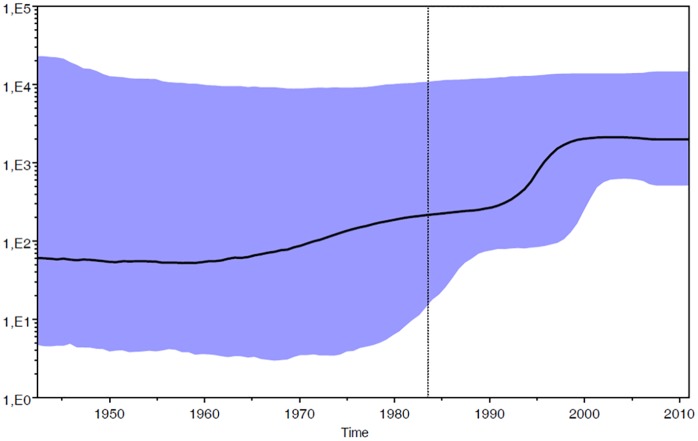
Fig 1. Skyline plot obtained by analyzing the data set of Italian patients (n = 53).
Ordinate: the number of effective infections at time t (Ne(t)); abscissa: time (in years before the present). The thick solid line represents the median value and the grey area the 95% HPD of the Ne(t) estimates. The vertical lines indicate the 95% lower HPD (dotted) and the mean tMRCA estimate (bold) of the tree root.

