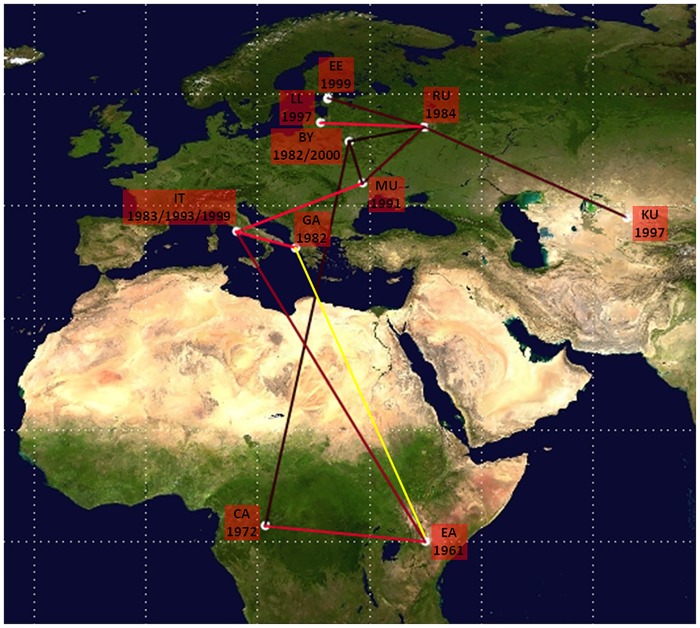
Fig 3. Significant non-zero HIV-1 A1 migration rates worldwide.
Only the rates supported by a BF of >3 are shown in red, yellow indicates the probable rate. The relative strength of the statistical support is indicated by the color of the lines (from dark red, id est weak to light red id est strong). The map was reconstructed using SPREAD program. This figure is similar but not identical to the original image, and is therefore for illustrative purposes only.

