
Figure 2.
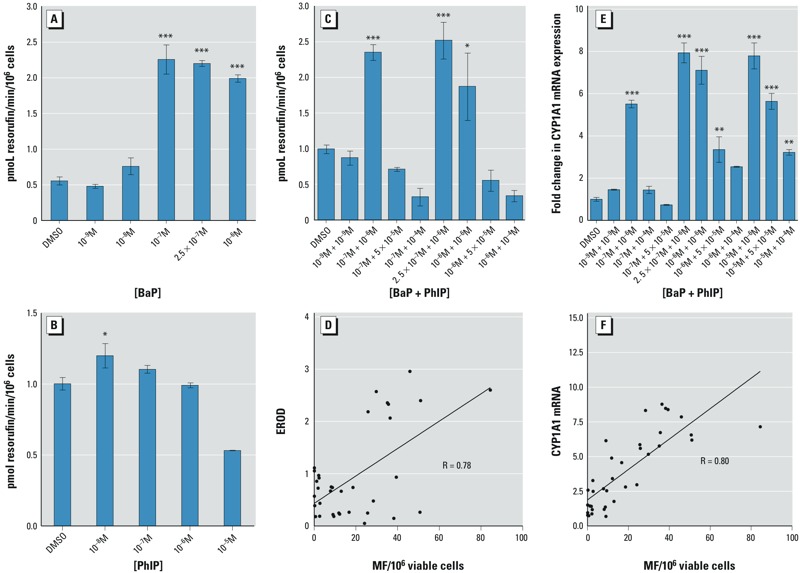
Effects of BaP and PhIP mixtures on CYP1A activity and CYP1A1 expression. For all mixtures, the concentration of BaP is stated first. Ethoxyresorufin-O-deethylase (EROD) activity was determined following a 24-hr treatment with (A) BaP, (B) PhIP, or (C) mixtures of BaP and PhIP. (D) CYP1A1 mRNA levels (Q-PCR, normalized to GAPDH) following a 24-hr treatment with mixtures of BaP and PhIP. Correlation of mixture TK MF with (E) mixture EROD or (F) mixture CYP1A1 mRNA levels. Data are means ± SEM, n = 3. Significance compared with the DMSO control (one-way ANOVA with Dunnett’s post-test; *p ≤ 0.05, **p ≤ 0.01, ***p ≤ 0.001).