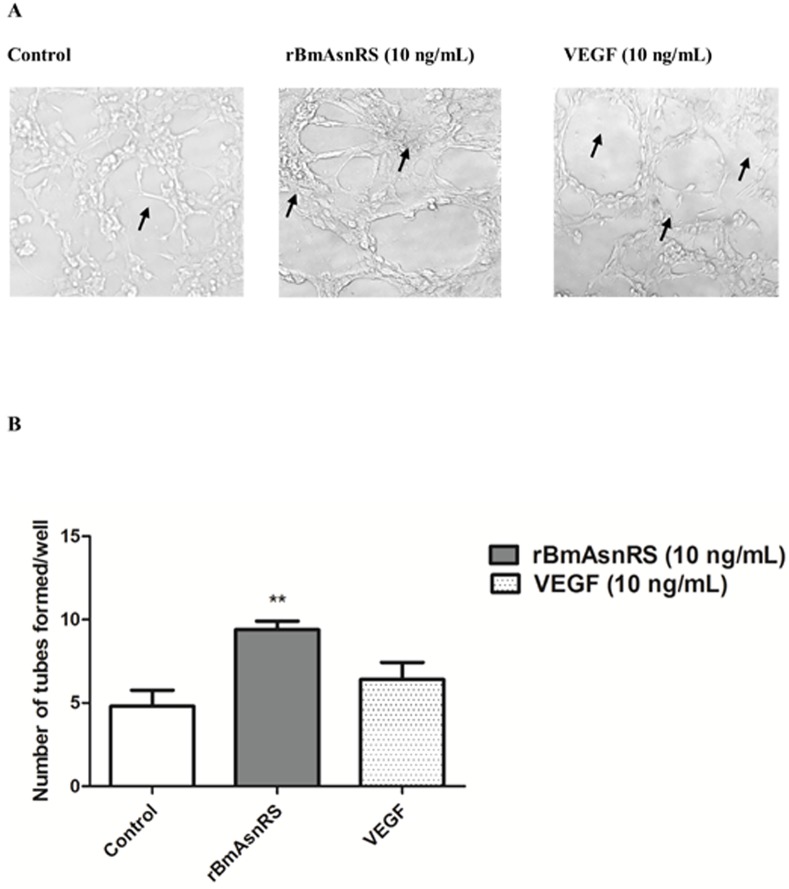
Fig 5. The effect of rBmAsnRS and VEGF on tube formation.
Fig 5A. Images indicate with arrows the endothelial tube formation in negative control, 10 ng/ml rBmAsnRS and 10 ng/ml VEGF groups. Photomicrographs were taken with 20X magnification under an inverted bright field microscope. Fig 5B. Graphical representation of the number of tubes formed by EA.hy926 cells exposed to negative control, 10 ng/ml rBmAsnRS or 10 ng/ml VEGF for 24 hours in Matrigel-coated 24-well plates. Data are presented as means ± SEM. Asterisk (*) denotes statistically significant differences compared to negative control.

