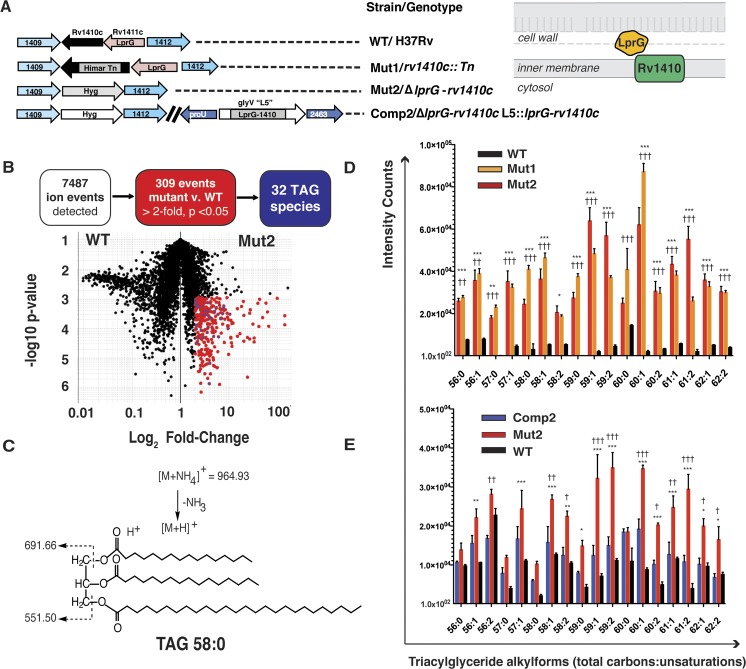
Fig 1. Lipidomics show that loss of LprG-Rv1410 results in triacylglyceride (TAG) accumulation in Mtb.
(A, left) Strains used in this study. (A, right) Schematic showing predicted localization of proteins encoded by genes manipulated in this study. (B) Positive mode comparative lipidomics analysis from stationary phase M. tuberculosis Mutant 2 (Mut2) and parental wild-type (WT) strains yielded 7487 total events (black and red) with 309 (red) that meet change criteria of a two-fold increase in Mut2 compared to WT at a corrected p <0.05 (student’s paired t-test, Gene Pattern, Broad Institute). Each dot represents the mean intensity over three biological replicates for a given molecular event in Mut2 compared to WT. For thirty-two of these the m/z values match the expected masses of TAG alkylforms (blue) detected as ammonium and hydrogen adducts. (C) Collision-induced dissociation mass spectrometry of a representative TAG (TAG 58:0, m/z 564.93). (D-E) Mean intensity values for molecular events mapping to TAG isoforms (ammonium adducts) with the indicated total number of carbons:unsaturations found in all alkyl chains in (D) WT, Mut1 and Mut2 and (E) WT, Mut2, and Complement (Comp2) strains. Error bars show mean +/- SD. * p<0.05, ** p<0.01, ***p<0.001, in (D) Mut1 (†) or Mut2 (*) vs. WT and (E) WT (*) or Comp2 (†) vs. Mut2; 2-way ANOVA with Bonferroni post-test correction.

