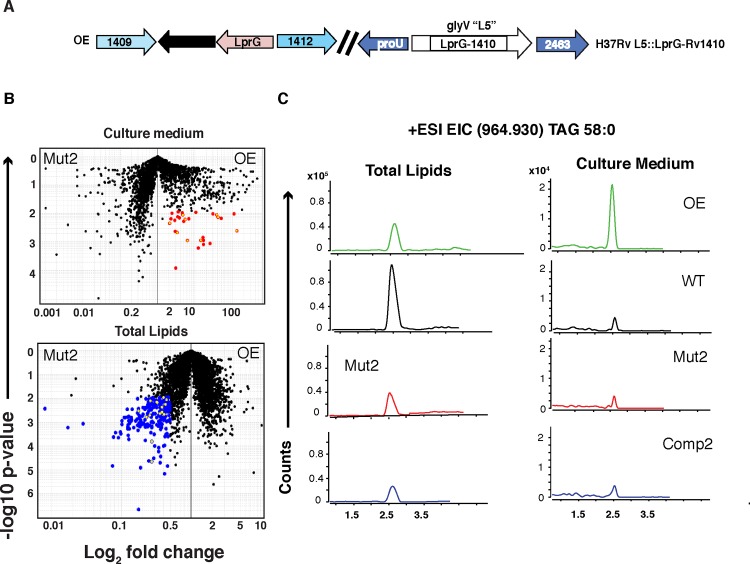
Fig 3. Overexpression of lprG-rv1410c increases TAG released into culture medium of broth-cultured cells.
(A) Schematic of the overexpression (OE) genotype. (B) Comparative lipidomes of culture medium (upper) and total cells (lower) derived from the OE vs. Mut2 strains from log-phase broth-grown cells (OD 0.7 +/- 0.2). Upper panel, OE vs. Mut2 culture medium (12.5 μg lipid); 2-fold increase, corrected p< 0.05 (red), TAG (yellow overlay). Lower panel, OE vs. Mut2 total cells (12.5 μg lipid); 2-fold decrease, corrected p< 0.05 (blue), TAG (yellow overlay). Student’s paired t-test (Gene Pattern, Broad Institute of Harvard, MIT, MGH). (C) Extracted ion chromatogram (EIC) for m/z 964.963 (TAG 58:0) in culture medium versus total cell lipid from OE, WT, Mut2, and Comp2 strains within the same MS experiment.

