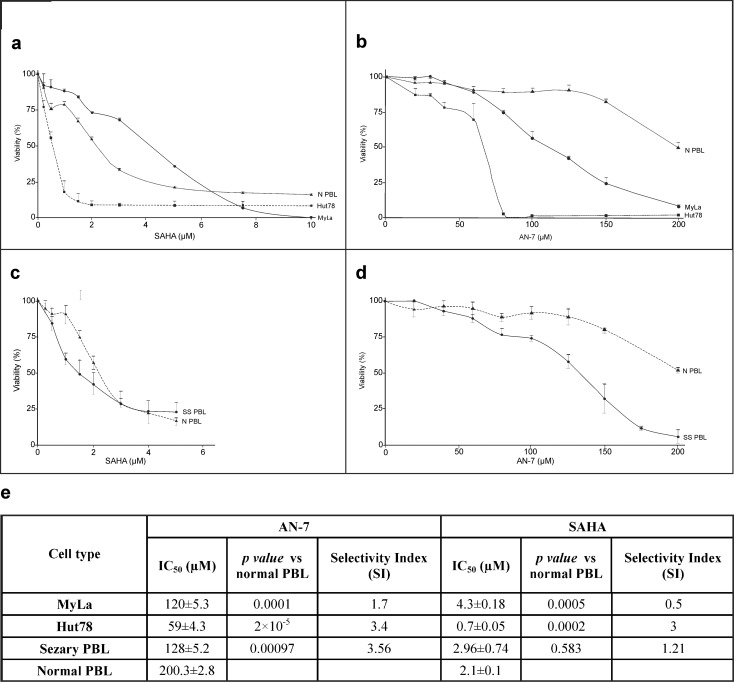
Fig 1. Effect of SAHA and AN-7 on the viability of MF/SS cell lines, SPBL and NPBL.
Viability curves based on the MTT assay of MyLa cells, Hut78 cells, (a,b), and SPBL (n = 3) (c,d) compared to NPBL (n = 8) following treatment with SAHA (a,c) and AN-7 (b,d) for 72 h. Also shown are the IC50 and SI values of SAHA and AN-7 in MF/SS cell lines and SPBL and NPBL based on viability curves a-d, and their p values (e).

