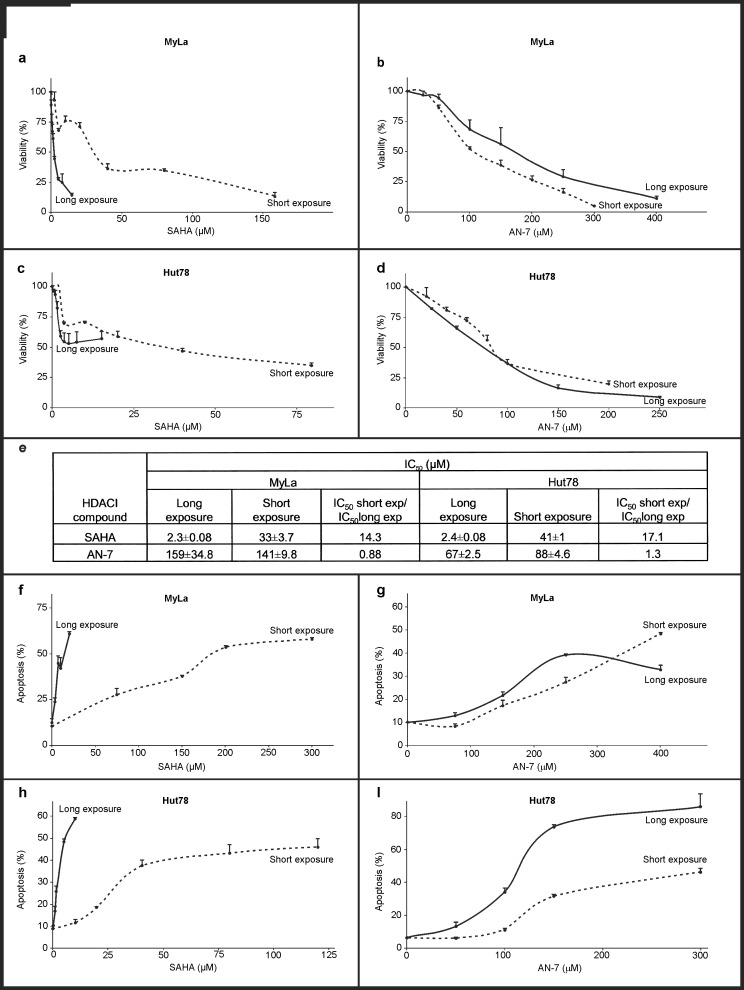
Fig 2. Toxic and apoptotic effect of SAHA and AN-7 on MF/SS cell lines as a function of exposure time.
Viability curves based on trypan blue staining of MyLa and Hut78 cells following short or long exposure to SAHA (a, c) or AN-7 (b, d). IC50 values of short and long exposure to SAHA and AN-7 in MF/SS cell lines based on viability curves a-d (e). Apoptosis curves based on FACS analysis of annexin V and PI staining (f-i). Percent of apoptotic MyLa cells (early + late apoptosis) after short or long exposure to SAHA (f) or AN-7 (g), and apoptotic Hut78 cells after short or continuous exposure to SAHA (h) or AN-7 (i).

