Figure 3.
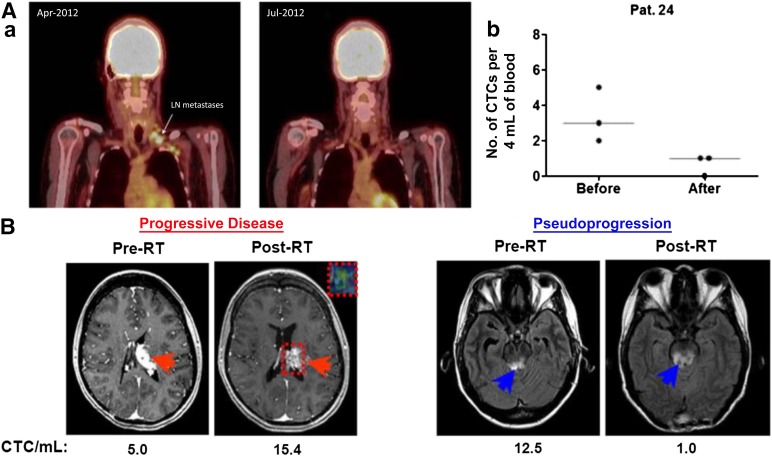
CTC levels may correspond to disease status. (Aa): Illustration of therapeutic response in a patient with metastatic melanoma who was treated with vemurafenib (reproduced from Klinac et al. [17], original vertical display edited to horizontal). Left panel: Representative images of the positron emission tomography scans before and during vemurafenib treatment. The arrow indicates lymph node metastasis detected prior to treatment and a complete metabolic response 2 months after treatment. Right panel: Reduction in the number of CTCs in 4 mL of whole blood in the same patient. A total of 12 mL of blood was collected at each time point (three 4-mL tubes). (Ab): The graph illustrates the number of CTCs found in each of the three blood samples and the median for each time point. (B): CTC trends differentiating between progressive disease and pseudoprogression in two patients with glioblastoma (reproduced with permission from MacArthur et al. [95]). Magnetic resonance imaging (MRI) was performed within 2 weeks prior to initiation of RT and approximately 1 month following completion of treatment. CTC results (given as number of CTCs per mL) are below the axial MR image at the respective time points. Red arrows indicate a left thalamic lesion prior to and following RT (left panels). The inset box delineated by the dotted red line in the post-RT image demonstrates the tumor area of interest and the associated advanced MRI relative cerebral blood volume map, which confirmed active tumor progression. Blue arrows indicate MR signal abnormality in the midbrain lesion and surrounding area on axial view prior to and following RT (right panels).
Abbreviations: CTC, circulating tumor cell; LN, lymph node; Pat. 24, patient 24; RT, radiation therapy.

