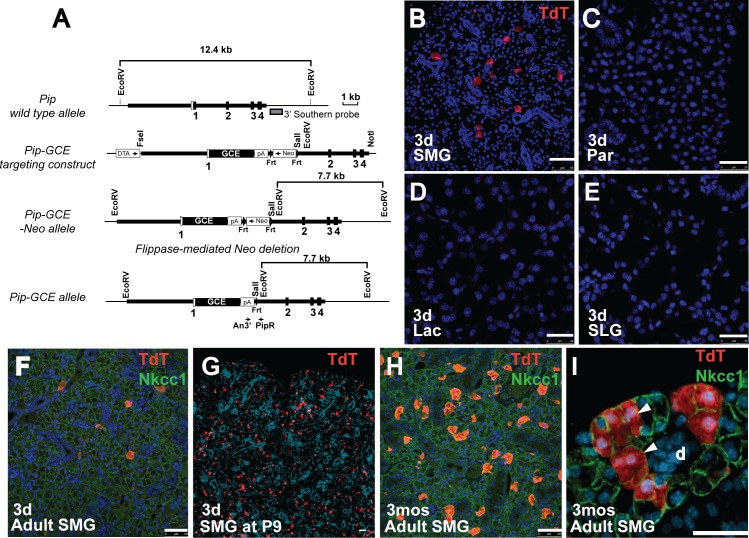
Fig 2. Characterization of PipGCE knock-in allele.
(A) Generation of PipGCE knock-in mice. Pip genomic structure and restriction map is shown at the top. White box represents the non-coding exon sequences and filled boxes, the coding sequences. Thick bars show the sequences used to generate the homologous arms in the targeting vector. Gray box represents 3’ external probe used for Southern blotting. Arrows indicate positions of genotyping PCR primers (An3’ and PipR). (B-E) Analysis of Cre expression in mice after 3 days of tamoxifen treatment, followed by a 3-day chase. (B) Frozen sections were prepared from submandibular gland (SMG); activation of Cre results in expression of Tomato red reporter (TdT) (red); Scale bar = 50 μm. No Cre activity is detected in (C) parotid (Par), (D) lacrimal gland (Lac) or (E) sublingual gland (SLG). Nuclei are stained with DAPI (blue). Scale bars = 25μm. (F) Section from PipGCE/+;R26 TdT/+ SMG at 3 days after tamoxifen treatment. Single labeled acinar cells (red) co-localize with antibody to Nkcc1 (green). Scale bar = 50μm (G) Section from PipGCE/+;R26 TdT/+ SMG at P9, isolated 3 days after tamoxifen administration. Positively labeled acinar cells are red. Nuclei are stained with DAPI. Scale bar = 25μm (H) Section from PipGCE/+;R26 TdT/+ SMG at 3 months after tamoxifen treatment, co-stained with antibody to Nkcc1 (green) to label acinar cells. Labeled acinar cells have expanded to clones (red). Scale bar = 50μm (I) Section from PipGCE/+;R26 TdT/+ SMG after 3 month chase shows expansion of labeled acinar cells into clones (arrowheads). 3d, 3 days chase; 3mos, 3 month chase; d, duct; Scale bar = 50 μm.

