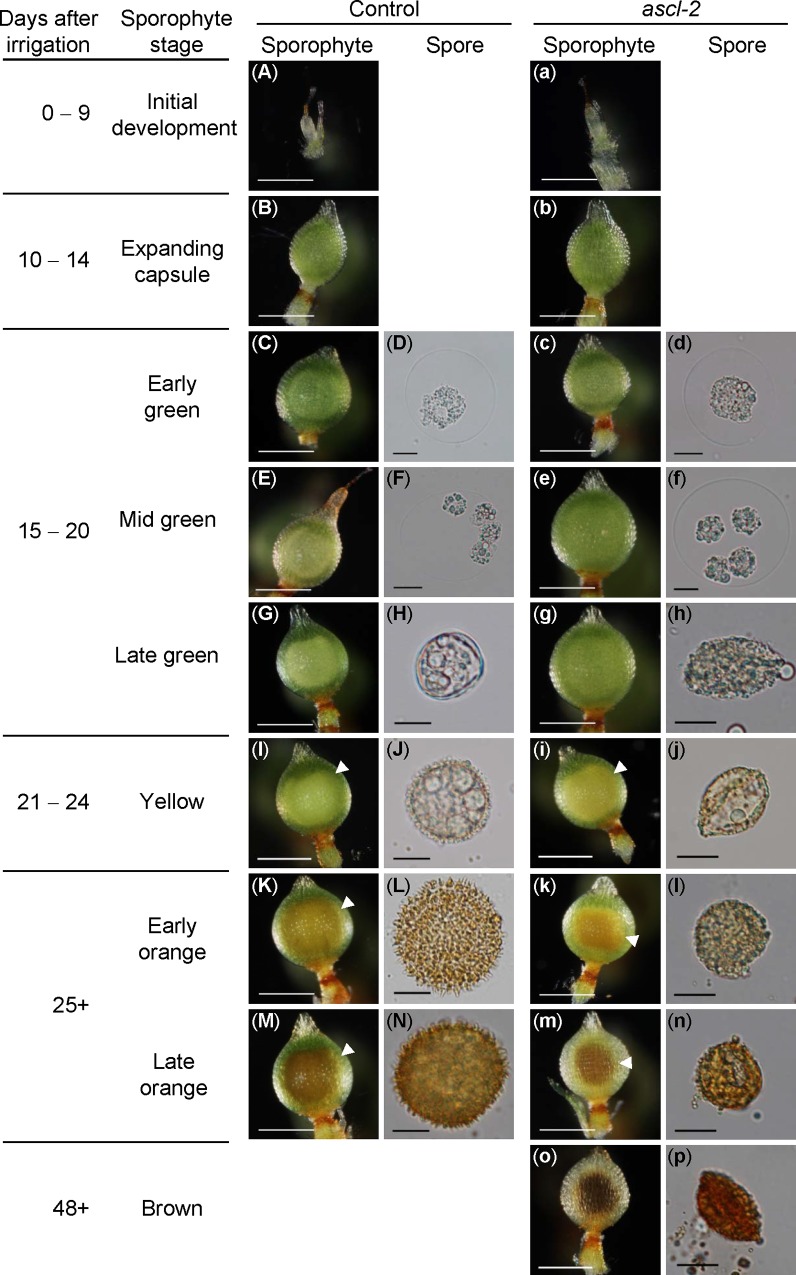
Fig 4. Developmental timelines for pabB4, the untransformed control strain, and ascl-2 sporophytes and spores.
Photomicrographs of the typical morphologies of sporophytes and spores of control (A–N) and ascl-2 (a–p) at successive developmental stages. The number of days after irrigation of the cultures is shown with the names assigned to each sporophytic stage. Some stages have been subdivided to allow more detailed description of changes in spore development. White arrowheads denote the outlines of the spore masses within capsules. No spores are seen during the initial growth and expanding capsule stages. The control did not reach the brown sporophytic stage during the observation period. Sporophyte scale bars = 500 μm; Spore scale bars = 10 μm.

