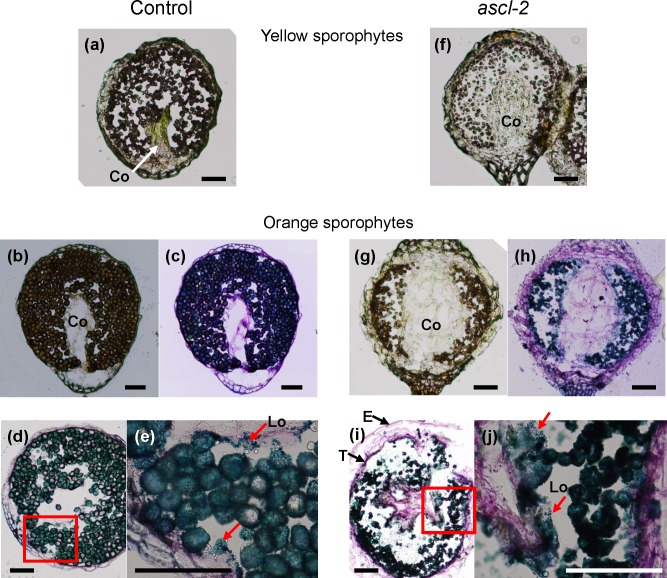
Fig 5. Photomicrographs of cryosectioned pabB4 control and ascl-2 sporophytes.
Cross sections of control (20 μm, a–e) and ascl-2 (30 μm, f–j) sporophytes were taken at the yellow (a,f) and orange (b–e, g–j) stages. Images were saved before (a,b,f,g) and after toluidine blue O staining (c–e, h–j). Orbicules present in locules of the air-space and on the tapetum wall surface are indicated with red arrows in (e) and (j). Sections (e) and (j) are magnified images of red-boxed areas of (d) and (i), respectively. Co, columella; E, epidermis; Lo, locule; T, tapetum. Scale bars = 100 μm.

