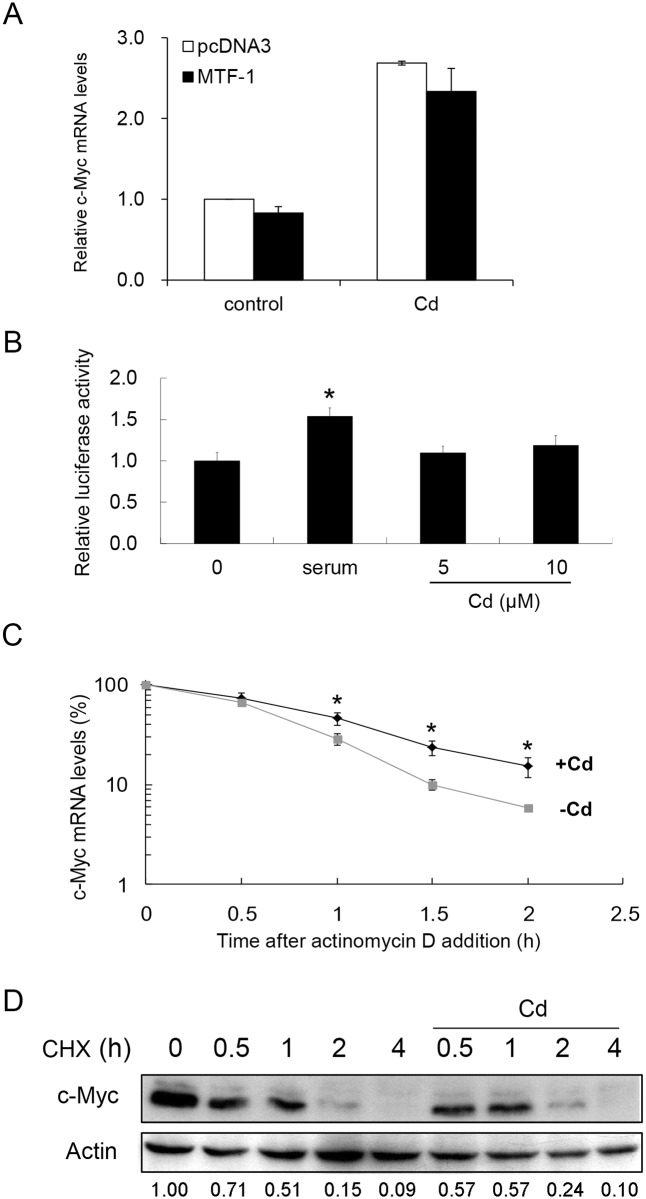
Fig 2. Analysis of factors that modulate the cellular c-Myc level after Cd administration.
(A) MTF-1 was over-expressed in HepG2 cells. After adding 0 or 5 μM Cd for 4 h, cells were harvested and cellular c-Myc mRNA was quantified by real-time PCR. (B) A reporter plasmid carrying the promoter region of the c-Myc gene (-1202 to +19) was transfected to HepG2 cells and cultured in serum-free medium for 24 h. The cells were then treated with 10% serum for 12 h or Cd at the concentrations specified for 4 h. Luciferase activities from the samples were analyzed. Asterisk (*) indicates significant difference (p < 0.05) as compared to that of the untreated control. (C) HepG2 cells were pretreated with 0 or 5 μM Cd for 2 h before adding actinomycin D to a final concentration of 5 μg/ml. Cells were harvested at various time intervals and c-Myc mRNA was quantified by real-time PCR. Asterisks (*) indicate significant differences (p < 0.05) between the paired samples (the same time interval). Each value represents a mean ± standard deviation of three samples. (D) HepG2 cells were pretreated with 20 μM cyclohexamide (CHX) for 15 min before adding 0 or 5 μM Cd. Cells were cultured for additional 4 h. Samples were removed at various time intervals and cellular c-Myc was examined by Western blotting. Actin was used as a loading control to normalize the amount of sample applied for analysis. Numbers underneath the Western blotting represent the amount of c-Myc relative to that of the loading control (actin).

