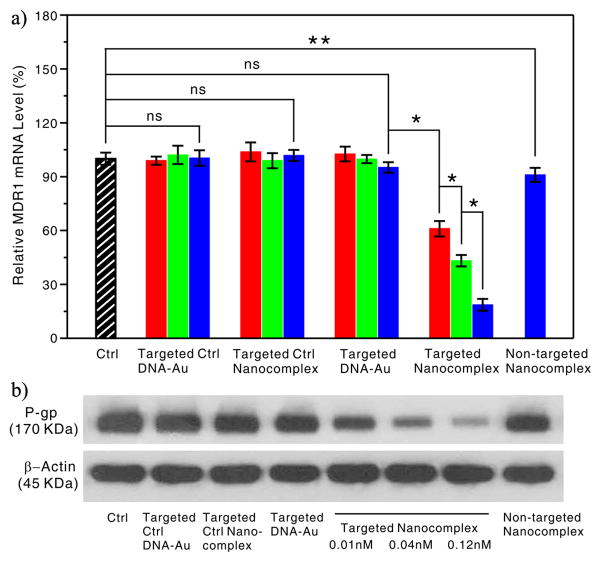
Figure 3.
Anti-MDR1 effects of the targeted anti-MDR1 nanocomplex in OVCAR8/ADR cells. a) qRT-PCR analyses of MDR1 mRNA expression in the OVCAR8/ADR cells treated with targeted nanocomplex or controls at varying doses: 0.01 nM (red), 0.04 nM (green) and 0.12 nM (blue), or non-targeted nanocomplex with 0.12 nM. Each bar presents the mean and standard deviation derived from three independent experiments; Student’s t test, ns = non-significance: P > 0.13, *: P< 0.006, **: P = 0.058. b) Western blot analyses of Pgp expression in the OVCAR8/ADR cells after treatment with nanoparticles at a concentration of 0.12 nM except for the targeted anti-MDR1 nanocomplexes at different concentrations of 0.01, 0.04 and 0.12 nM, which was probed with anti-Pgp antibody and anti-β-actin antibody, respectively.

