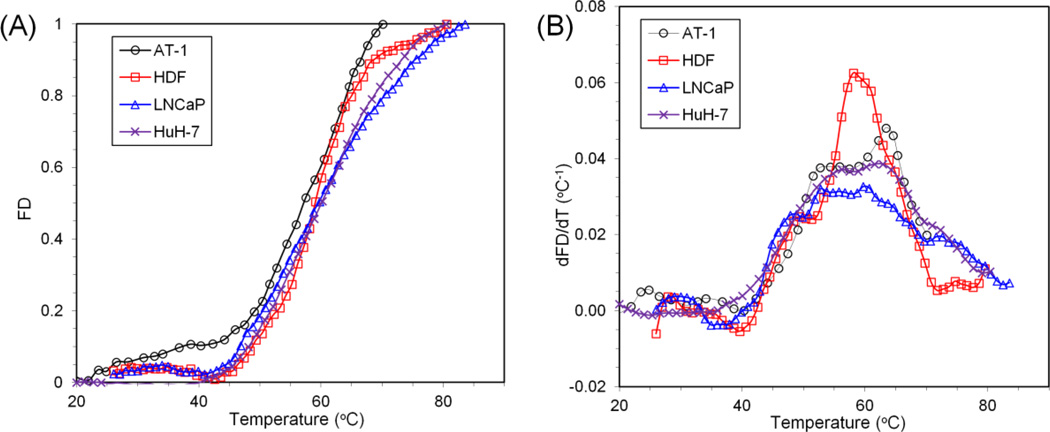
Figure 6.
Protein denaturation signature of four different cell types (AT-1, HDF, LNCaP, and HuH-7). (A) Comparison of the protein denaturation of four different cell types – Dunning AT-1 prostate cancer cells, human dermal fibroblasts (HDF), LNCaP prostate tumor cell, and HuH-7 liver cancer cell – characterized by monitoring changes to the extended β-sheet structures as a function of temperature increase from 20°C to 90°C. The error bars were omitted for easier data visualization. (B) First derivative of the average denaturation curves are plotted as a function of temperature. Note that AT-1 data is from He et al.[8] and HuH-7 data is from Avaralli et al.[5] FD: Fractional Denaturation.

