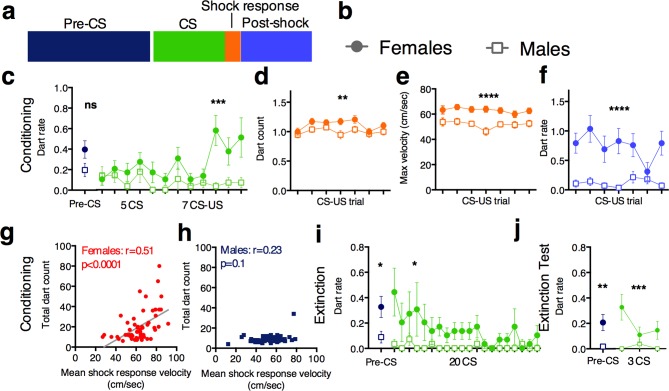
Figure 2. Sex differences in darting responses during fear conditioning and extinction.
(a) The 4 fear conditioning epochs in which velocity was recorded. Graphs in c-f and i-j are color coded to match, and represent mean +/- SEM. (b) In graphs c-f and i-j, females are represented by filled circle, males by an open square. (c) Pre-CS (final 60 sec before 1st CS presentation) and CS dart rate (darts/min) during conditioning. (d) number of darts observed during 5s shock (US) response periods. (e) maximum velocity reached during 5s shock (US) response periods. (f) mean dart rate observed during 30s post-shock period. (g) and (h) Pearson’s correlations of mean shock response velocity and total session dart count [note that visible male outlier was removed from analysis for being 6 SDs above mean total dart count. When included, r=0.34, p<0.05]. (i) Pre-CS and CS dart rate (darts/min) during Extinction. (j) Pre-CS and CS dart rate (darts/min) during Extinction testing. *p<0.05; **p<0.01; *** p<0.001; ****p<0.0001 males vs. females.

