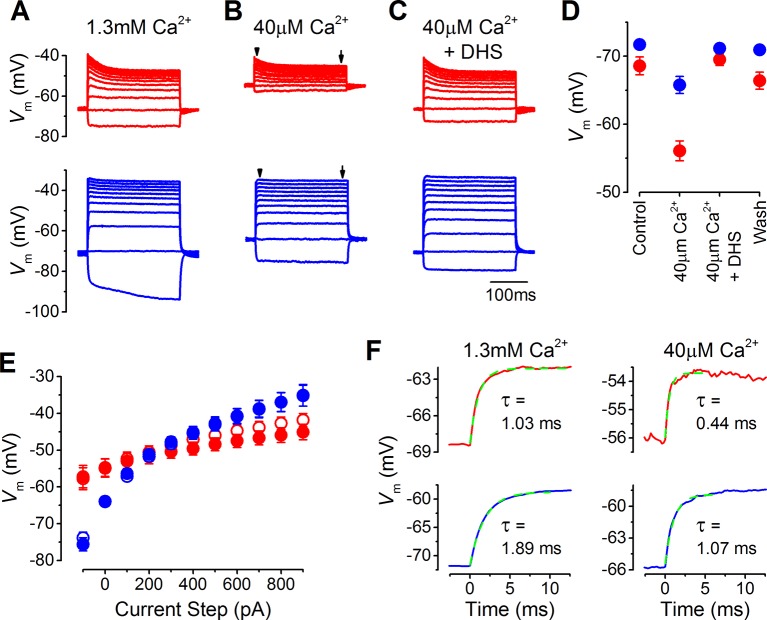
Figure 2. The resting membrane potential in apical and basal inner hair cells (IHCs) from adult gerbils.
(A–C) Current clamp responses of apical (top panels) and basal (lower panels) IHCs from adult gerbils in response to 100 pA current steps from -100 pA to 900 pA from the cells’ resting potential (Vm). From left to right are responses in 1.3 mM extracellular Ca2+ (A), low-Ca2+ (40 µM) endolymph-like solution (B), and low-Ca2+ solution with 100 µM dihydrostreptomycin (DHS) (C). Traces are averages from all IHCs (apical: n = 12; basal: n = 11). (D) Average Vm values measured before the current steps in the different extracellular conditions as in (A–C), including the washout with 1.3 mM Ca2+, for apical (red) and basal (blue) IHCs. (E) Average peak (open symbols) and steady-state (closed symbols) Vm from apical and basal IHCs measured at different current injection levels from the current clamp recordings in low-Ca2+ in (B). The arrowheads/arrows in (B) indicate where the peak and steady state Vm were measured. Note that the voltage responses of basal cells to a sustained current step, similar to a high-frequency tone, are more clearly graded to the stimulus amplitude than those in apical cells in terms of the dynamic range of voltages covered. (F) Average onset of the initial Vm response to 100 pA current injection in 1.3 mM Ca2+ (left) and low-Ca2+ (right) for apical IHCs (top panels, n = 12) and basal IHCs (bottom panels, n = 11). The initial rise to peak was fit with a single exponential function. The average time constant (τ), obtained from fitting the individual cells, was (apical IHCs) 1.03 ± 0.11 ms in 1.3 mM Ca2+ and 0.44 ± 0.08 ms in low-Ca2+; (basal IHCs) 1.89 ± 0.19 ms (1.3 mM Ca2+) and 1.07 ± 0.13 (low-Ca2+).

