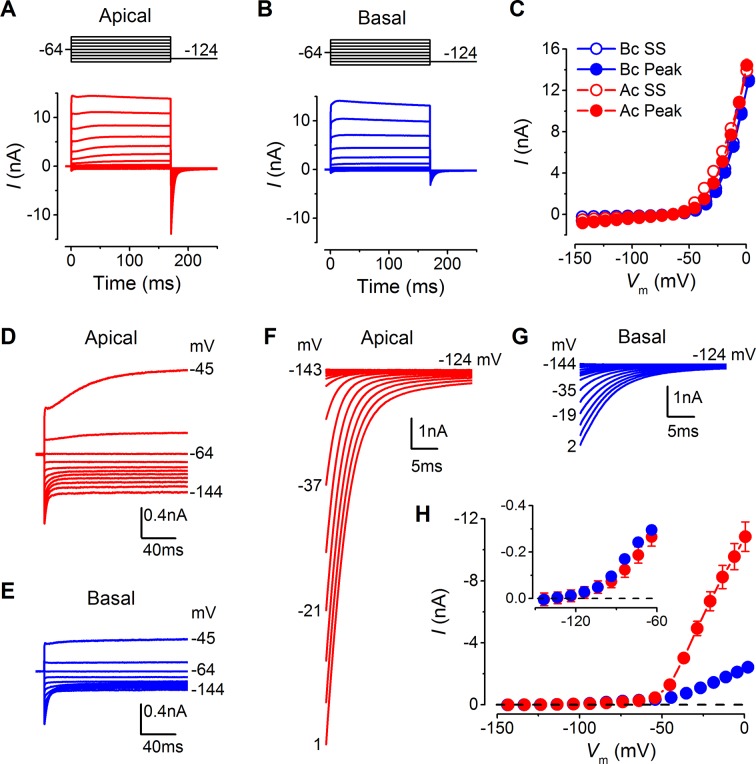
Figure 3. Differences in the basolateral membrane currents of apical and basal adult gerbil inner hair cells (IHCs).
(A and B) Basolateral membrane currents elicited from apical (A, red) and basal (B, blue) IHCs in response to depolarizing voltage steps in nominal 10 mV increments from –144 mV (holding potential: –64 mV). Tail currents were measured upon returning to –124 mV (protocol shown above the current traces). Traces are averages from 26 apical and 27 basal IHCs. (C) Average current-voltage (I-V) curves for apical and basal IHCs. Peak currents were measured at 2 ms from the onset of the test step and steady-state values were obtained at around 160 ms. (D and E) Average current traces as in (A) and (B), but on an expanded y-scale to show more clearly the time course of the currents at more negative membrane potentials. (F and G) Average tail currents from apical and basal IHCs, respectively, from the different test potentials shown by some of the traces (amplified from [A] and [B]). (H) Average activation curves for apical and basal IHCs made by plotting the instantaneous tail current amplitude against the preceding voltage step. The inset shows the activation of the K+ currents on an expanded scale.

