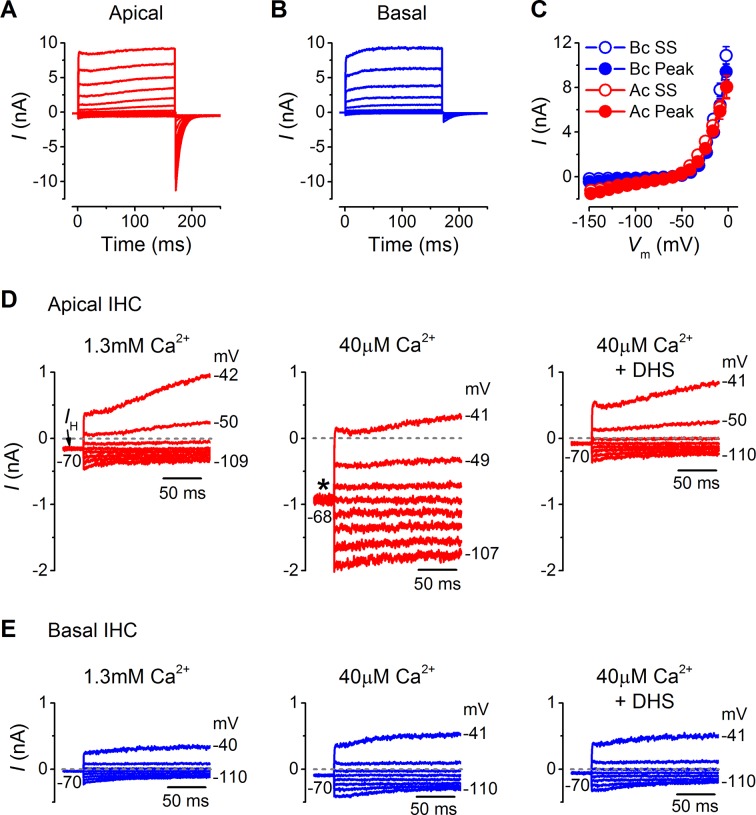
Figure 5. Endogenous Ca2+ buffering does not affect differences in basolateral membrane currents or the resting mechanotransducer (MT) current in apical and basal adult gerbil inner hair cells (IHCs).
(A and B) Basolateral membrane currents elicited from apical (A, red) and basal (B, blue) IHCs as in Figure 3A and B. (C) Average peak and steady-state current-voltage (I-V) curves for apical (n = 3) and basal (n = 4) IHCs. (D and E) Membrane currents covering a physiological range of IHC membrane potentials elicited from the holding potential of around -70 mV. The holding current is indicated in the first panel as IH. Recordings were made in standard 1.3 mM extracellular Ca2+ (left panels), 40 µM Ca2+ (middle panels), and 40 µM Ca2+ with 100 µM DHS (right panels). Low Ca2+ (40 µM) elicited a large inward holding current only in apical IHCs (asterisk) that was blocked by DHS.

