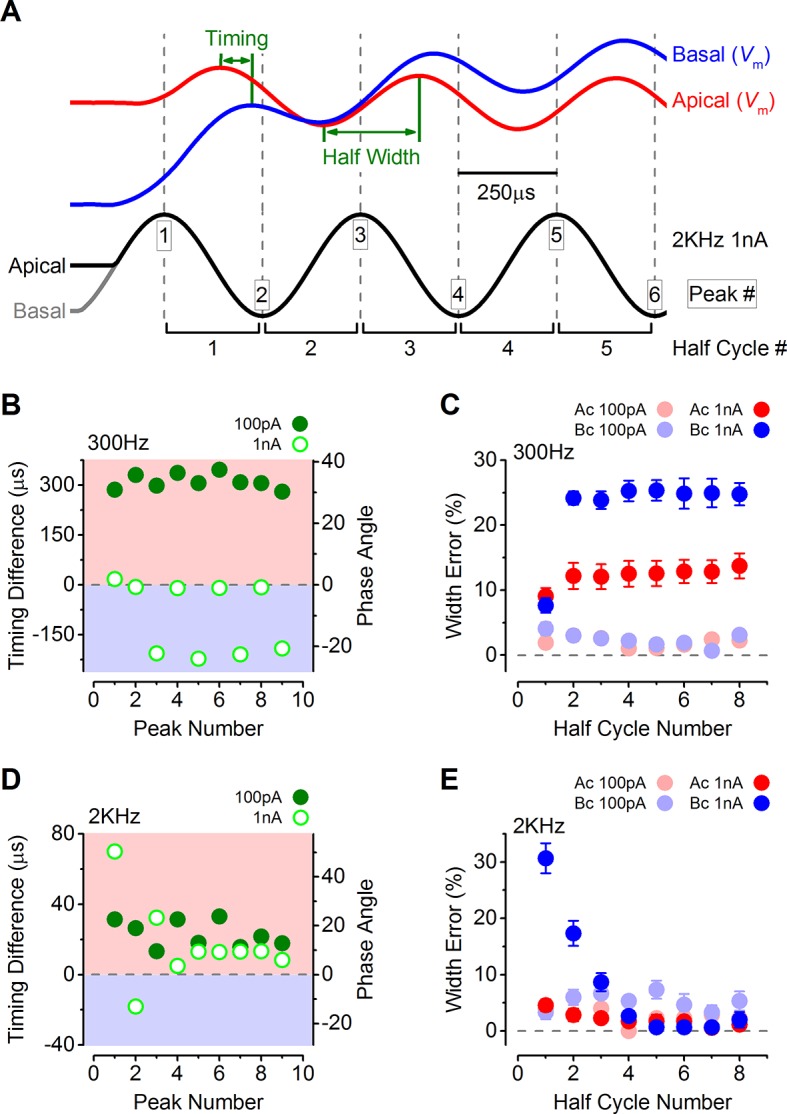
Figure 8. The timing of phasic responses to sound-like stimulation is faster and more accurate in apical inner hair cells (IHCs).

(A) IHC responses to a 1 nA, 2 kHz stimulus showing the relative timing shift between apical and basal cells (above) to the sinewave stimuli (below; apical black and basal grey). Dashed vertical lines delineate each half cycle of the 2 kHz stimulus with the half-cycle number shown. The numbers on the dashed vertical lines indicate the maxima and minima peak number used for subsequent analysis. Note that the responses of apical and basal IHCs are both delayed compared to the stimulus but the corresponding peaks and half cycles can be seen. The difference in timing between apical and basal traces is shown and was measured as the time delay between the occurrences of the equivalent peaks. The half widths were measured as the time between maximal and minimal peaks for each response half cycle. (B) The average timing difference between the arrival of the different peaks between apical and basal responses for 300 Hz stimuli (the symbols represent two stimulus amplitudes). Data points were obtained by subtracting the average apical value from that of basal cells. Therefore positive values (light red area) indicate an apical lead whereas negative values (light blue area) indicate a basal lead. The right-hand scale shows the corresponding shift in phase angle for the equivalent timing differences, calculated based on the size of the time difference and the stimulus frequency. (C) Average half-cycle width errors for apical and basal responses to 300 Hz stimuli of different amplitudes. Errors were calculated for each cell as the width of each half cycle in milliseconds divided by the actual half-cycle width of the stimulus (1.67 ms for 300 Hz) and converted to percentage. (D and E) Timing differences and half width errors, respectively, calculated as in (B) and (C) but for 2 kHz stimuli (half-cycle width of 0.25 ms).
