. 2015 Oct 29;4:e06011. doi: 10.7554/eLife.06011

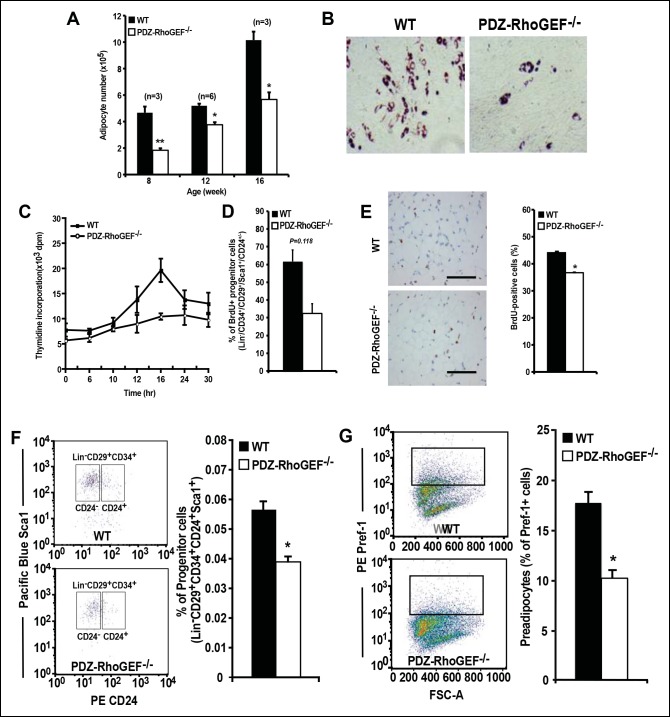
Figure 3. Reduced adipocytes and progenitors in PDZ-RhoGEF KO mice.

(A) Adipocyte numbers from 8-, 12-, 16-week old WT and PDZ-RhoGEF KO EWATs, (B) In vitro adipogenesis of EWAT ADSCs prepared from 16 week-old WT and PDZ-RhoGEF KO animals assessed by Oil Red-O staining. (C) DNA synthesis of EWAT-derived ADSCs upon insulin stimulation during MCE. (D) Adipogenitc progenitor cell proliferation presented as percent of BrdU + cells by FACS analysis under normal culture condition (n = 3). (E) Image and ImageJ quantification of BrdU-labeled EWATs from one-month old mice (n = 6–9). Bar scale = 100 μm (200X). Statistical significance was calculated by a Student’s t test using Excel software (*p<0.05, **p<0.01, ***p<0.001). (F) Stromal-vascular fraction from adult WT and PDZ-RhoGEF KO EWATs. EWAT was stained with adipogenic progenitor cells (CD29+/CD34+/CD24+/Sca1+) (n = 4). (G) Preadipocytes in WT and PDZ-RhoGEF KO EWAT stromal-vascular fraction were stained with preadipocyte marker, pref-1 (n = 3). Statistical significance was calculated by a Student’s t test using Excel software (*p<0.05, **p<0.01, ***p<0.001).

DOI: http://dx.doi.org/10.7554/eLife.06011.010

Figure 3.

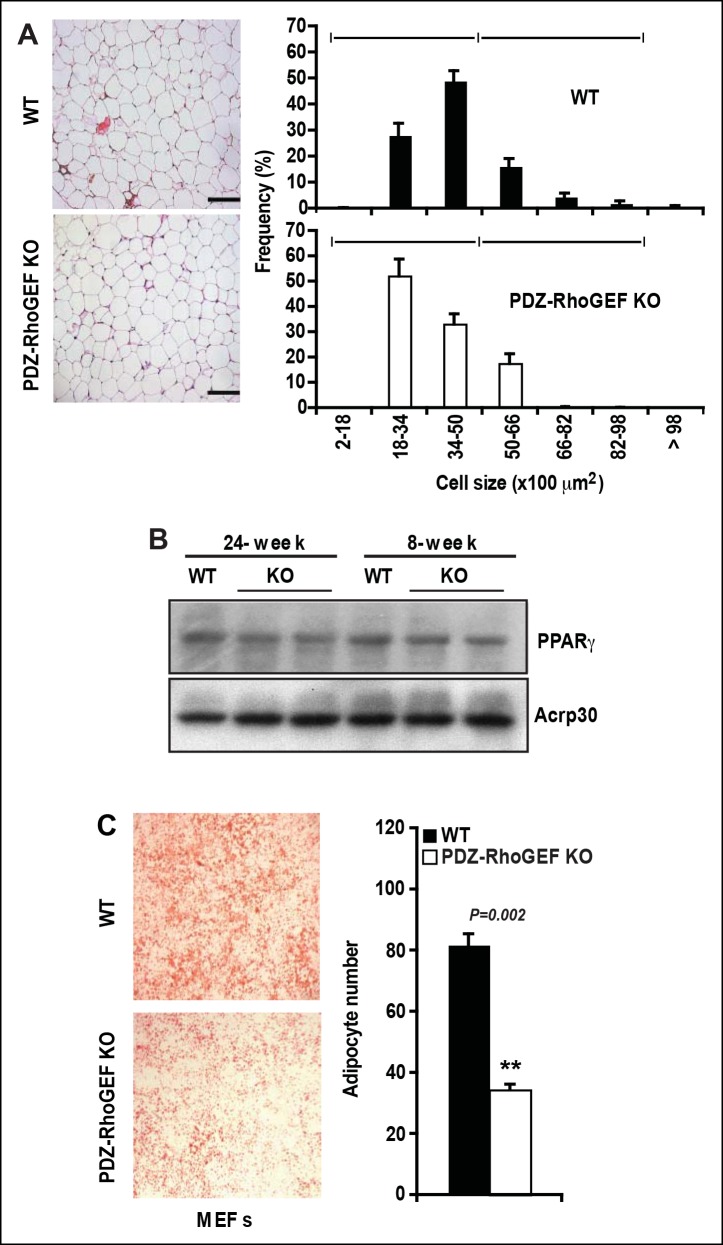
Figure 3—figure supplement 1. Cell size, adipogenic potential, and in vitro adipogenesis.

Figure 3—figure supplement 1.

(A) Morphometric analysis of epididymal adipocyte cell size of WT and PDZ-RhoGEF KO mice (n = 5–7). Scale bar = 100 μm (100X). (B) The protein levels of PPARγ and adiponectin (Acrp30) in EWAT from 24- and 8-week old WT and PDZ-RhoGEF KO mice. Statistical significance was calculated by a Student’s t test using Excel software (*p<0.05, **p<0.01, ***p<0.001). (C) In vitro adipogenesis of MEFs (E14.5) from WT and PDZ-RhoGEF KO assessed by Oil Red-O staining (n = 3). Statistical significance was calculated by a Student’s t test using Excel software (*p<0.05, **p<0.01, ***p<0.001).
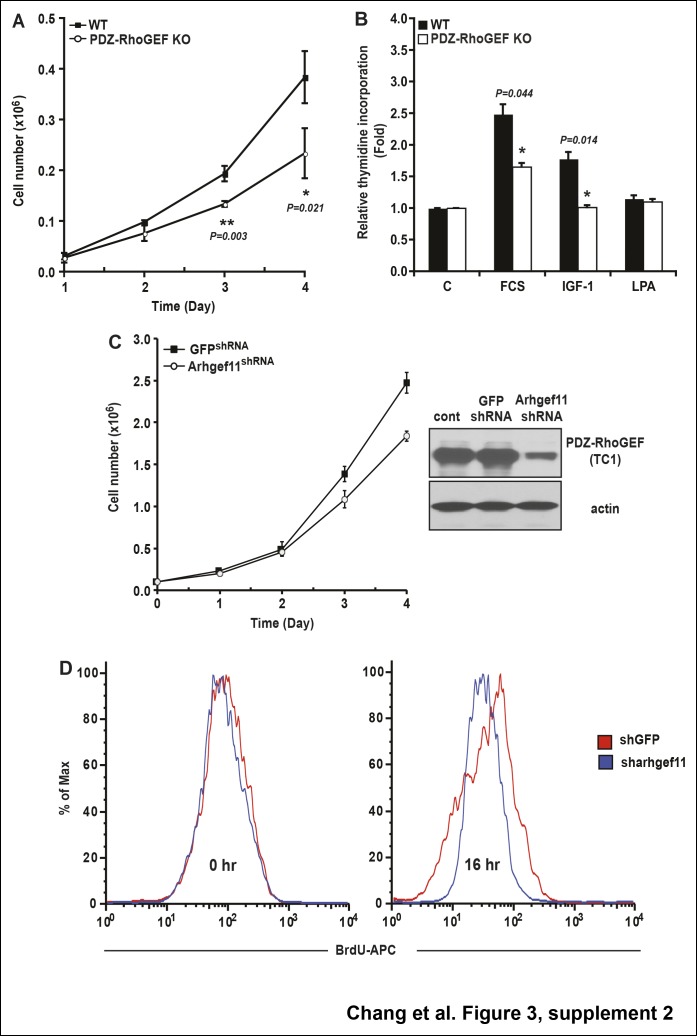
Figure 3—figure supplement 2. The role of PDZ-RhoGEF in cell proliferation.

Figure 3—figure supplement 2.

(A) Impaired proliferation of PDZ-RhoGEF KO MEFs grown in FCS. Cells were counted on the indicated days (n = 3). (B) [3H]-thymidine incorporation of WT and PDZ-RhoGEF KO MEFs in response to the indicated factors (n = 3). Statistical significance was calculated by a Student’s t test using Excel software (*p<0.05, **p<0.01, ***p<0.001). (C) Impaired proliferation of 3T3-L1 preadipocytes with reduced PDZ-RhoGEF expression under normal culture condition. Cells were counted on the indicated days. Expression of PDZ-RhoGEF was determined by immunoblotting (control: parental 3T3-L1). (D)Impaired insulin-mediated cell proliferation in 3T3-L1 preadipocytes when PDZ-RhoGEF expression was reduced, judged by percent of BrdU + cells, representative of three independent experiments.
Figure 3—figure supplement 3. PDZ-RhoGEF regulates clonal expansion during adipocyte differentiation in vitro.
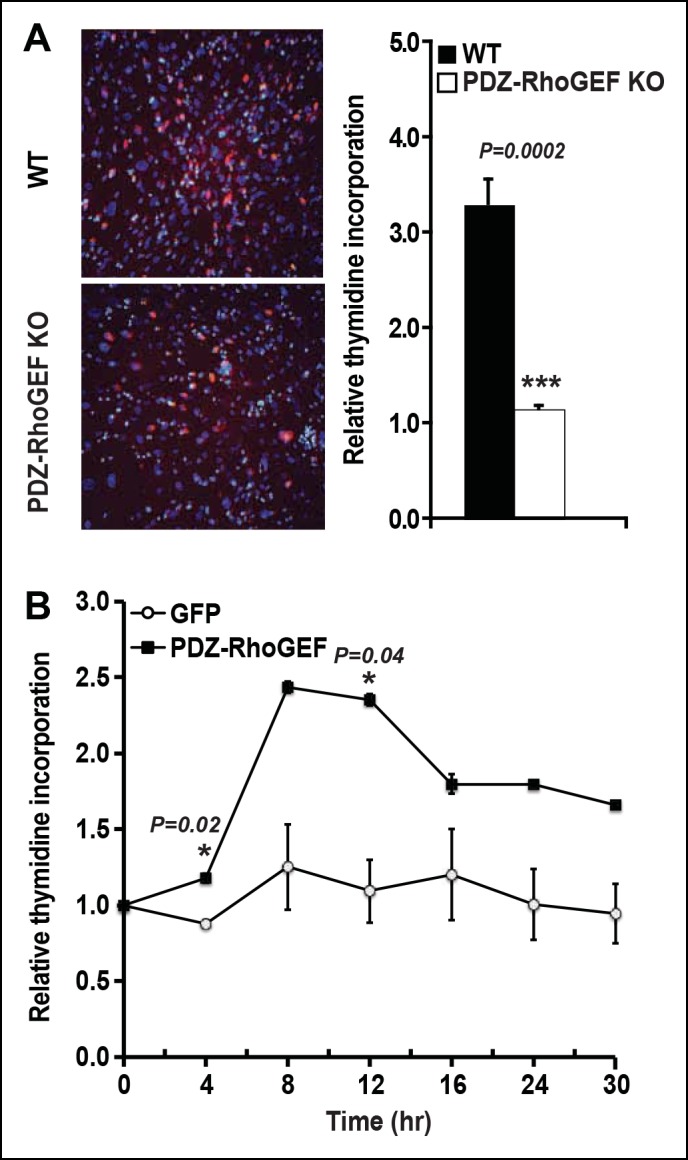
Figure 3—figure supplement 3.

(A)Reduction of post-confluent mitosis determined by [3H}-thymidine incorporation and mitotic clonal expansion in PDZ-RhoGEF KO MEFs during in vitro adipogenesis, pulsed-chased by BrdU + (Red) and counterstained by DAPI (Blue). (B)Overexpression of PDZ-RhoGEF resulted in increased DNA synthesis in 3T3-L1 cells after induction of adipogenesis. Statistical significance was calculated by a Student’s t test using Excel software (*p<0.05, **p<0.01, ***p<0.001).
Figure 3—figure supplement 4. Strategy of FACS-based purification of adipogenic progenitor cells.

Figure 3—figure supplement 4.

Adipogenic progenitor cells were sorted from the adipogenic progenitor specific maker-labeled SVF suspensions with AriaII (Becton Dickson) cell sorter, and the purity of sorted cells verified as >95% by rerunning the sorted population.
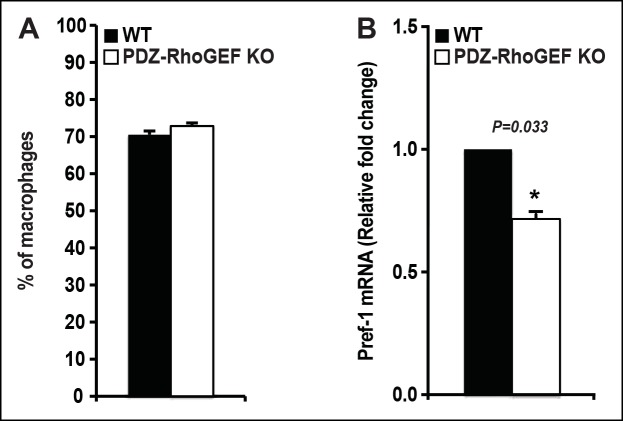
Figure 3—supplement 5. The proportion of resident/infiltrating adipose tissue macrophages and the expression of preadipocyte marker (Pref-1) from NCD-fed WT and PDZ-RhoGEF KO mice.

Figure 3—supplement 5.

(A) Quantification of adipose tissue macrophages (n = 6–9) from 4 weeks old WT and PDZ-RhoGEF KO mice. (B) The levels of Pref-1 mRNA in 16 weeks old WT and PDZ-RhoGEF KO EWAT SVF were determined by qPCR (n = 4). Statistical significance was calculated by a Student’s t test using Excel software (*p<0.05, **p<0.01, ***p<0.001).