. 2015 Nov 26;4:e10586. doi: 10.7554/eLife.10586

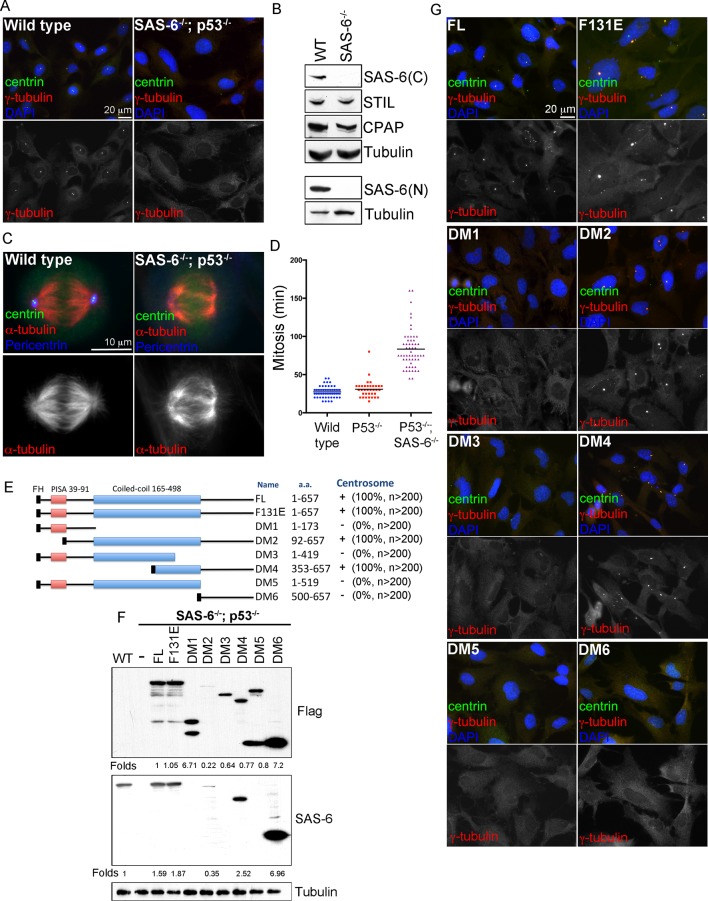
Figure 1. De novo centrosome formation in the absence of SAS-6 self-oligomerization. .

(A) Wild-type (WT) or acentrosomal (p53-/-; SAS-6 -/-; clone #1) RPE1 cells were stained with anti-centrin (green) and γ-tubulin (red). DNA (DAPI, blue). (B) Western blot analysis of WT or SAS-6-/- cells with indicated antibodies, including both N- and C-terminal SAS-6 antibodies (SAS-6N; SAS-6C). (C) WT or acentrosomal cells in mitosis were stained with anti-centrin (green), α-tubulin (red), and pericentrin (blue). (D) The duration of mitosis in WT or SAS-6-/- cells was measured through time-lapse imaging of live cells. (E) A schematic diagram showing various SAS-6 mutants tagged with Flag and HA (FH). Clone #1 p53-/- SAS-6-/-  cells were infected with lentiviruses carrying various of SAS-6 constructs, and the ability of each construct in rescuing centrosome formation was indicated and quantified in infected cells expressing detectable HA-tagged SAS-6. n, number of infected cells examined. (F) Isogenic SAS-6-/-;  p53-/-  cells carrying indicated SAS-6 constructs (see Methods) were induced for SAS-6 expression for 3 days and then analyzed by western blot with Flag antibodies or C-terminal SAS-6 antibodies (SAS-6C). For analyses with N-terminal SAS-6 antibodies (SAS-6N), please see Figure 1—figure supplement 1D. Note that in Flag staining, DM6 leaked to the lane of DM5. The expression level of each SAS-6 construct, indicated as fold changes (Folds) relative to the endogenous SAS-6 or SAS-6FL, is shown. (G) Isogenic SAS-6-/-;  p53-/- cells carrying indicated SAS-6 constructs were treated as (F) and analyzed by immunofluorescence microscopy using indicated antibodies (Scale bar: 20 μm in A and G, 10 μm in C).

DOI: http://dx.doi.org/10.7554/eLife.10586.003

Figure 1.

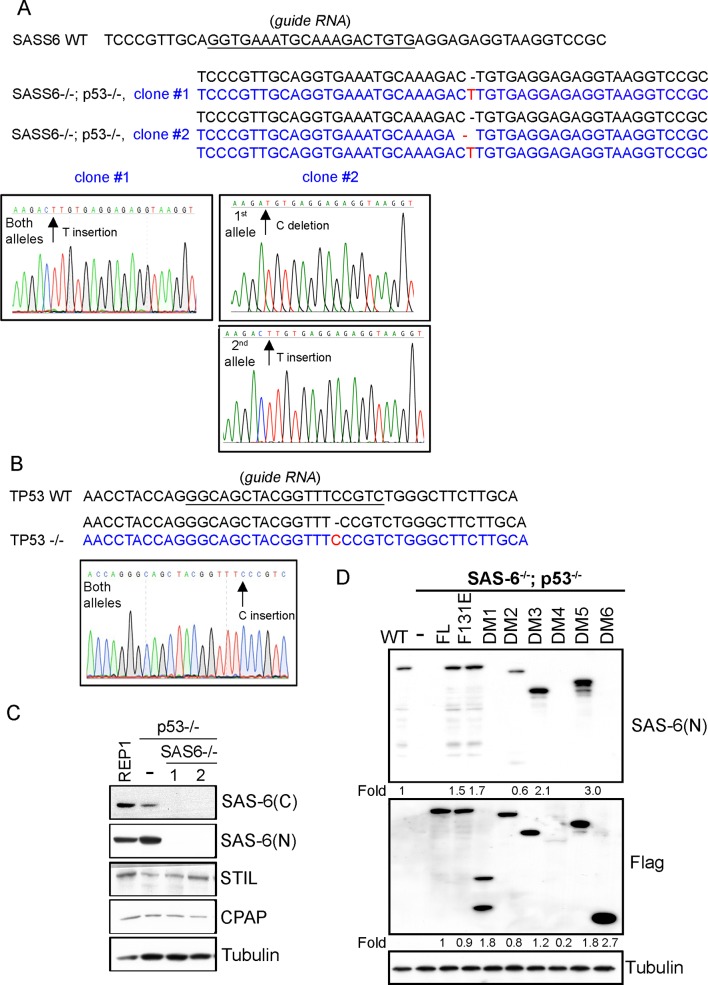
Figure 1—figure supplement 1. Characterization of SAS6-/-; p53-/- cell lines (clone #1 and #2).

Figure 1—figure supplement 1.

(A, B) Sequence analyses of SAS-6 and p53 alleles in clone #1 and clone #2 as indicated. The sequence of wild-type and edited alleles are in black and blue, respectively. The lesion (deletion or insertion) is shown in red. (C) Western blot analysis of WT, SAS6-/-; p53-/- clone #1, and SAS6-/-; p53-/- clone #2 cells with indicated antibodies. SAS-6C and SAS-6N are antibodies recognizing the N-terminus and C-terminus of SAS-6, respectively. (D) Isogenic SAS6-/-; p53-/- cells carrying indicated SAS-6 constructs (see ‘Methods’) were induced to express indicated SAS-6 mutants for 3 days as in Figure 1F, and then processed for Western blot with N-terminal SAS-6 antibodies (SAS-6N), Flag antibodies, and tubulin antibodies as the loading control. The expression level of each SAS-6 construct, indicated as fold changes (Folds) relative to the endogenous SAS-6 or SAS-6FL, is shown.
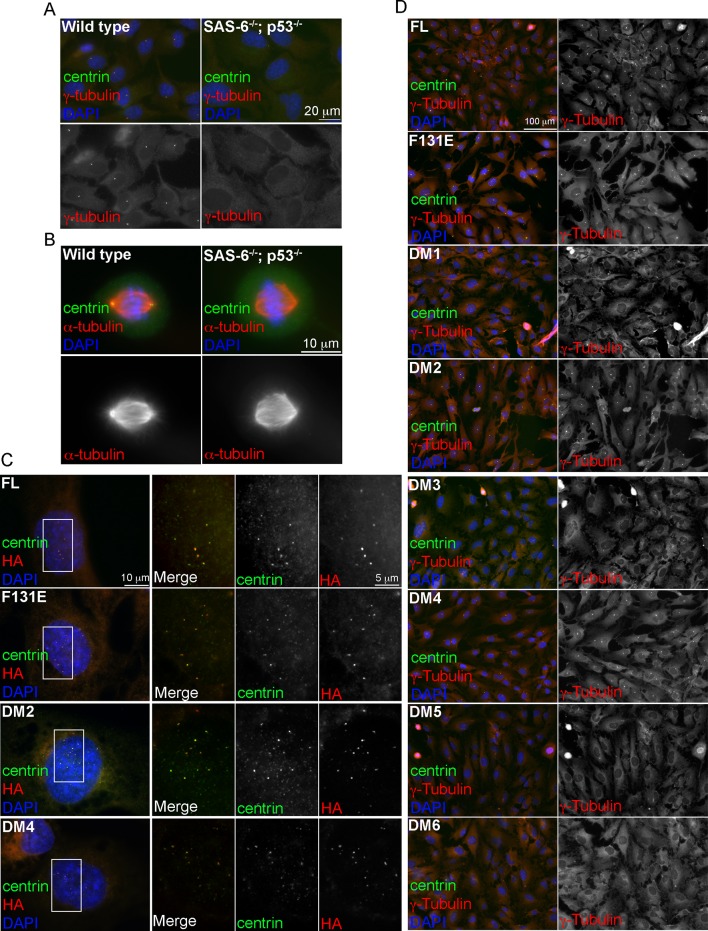
Figure 1—figure supplement 2. Induction of de novo centrosome formation in clone #2 SAS6-/-; p53-/- cells in the absence of SAS-6 self-oligomerization.

Figure 1—figure supplement 2.

(A, B) Wild-type (WT) or clone #2 acentrosomal (p53-/-; SAS-6 -/-) RPE1 cells were stained with indicated antibodies during interphase (A) and mitosis (B). DNA (DAPI, blue). (C, D) Clone #2 acentrosomal cells were infected with lentiviruses, and induced to express indicated SAS-6 constructs for 16h (C) or 3 days (D). The ability of each SAS-6 mutant in rescuing de novo centriole (C) or centrosome (D) formation was examined with indicated antibodies. HA staining marks SAS-6.