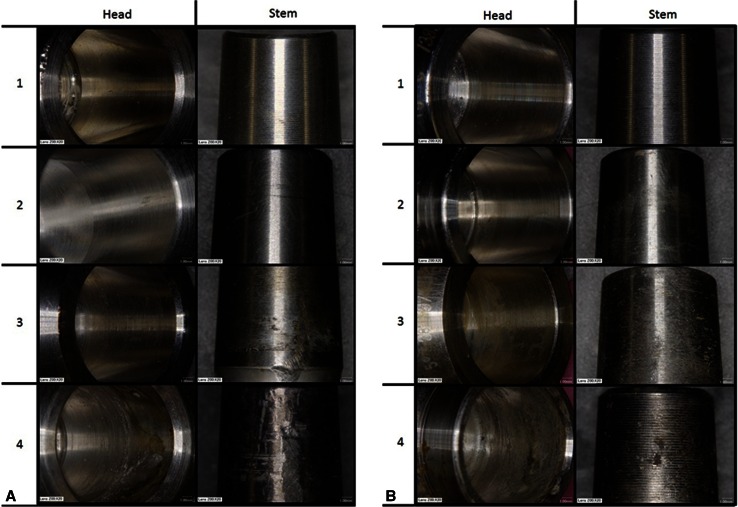
Fig. 3A–B.
Microscopic images of the head taper and the stem trunnion are shown with sequentially higher scores for fretting (A) and corrosion (B). The left column of each picture represents the scores of the scale [19] with 1 corresponding to the absence of any damage and 4 corresponding to excessive fretting/corrosion.

