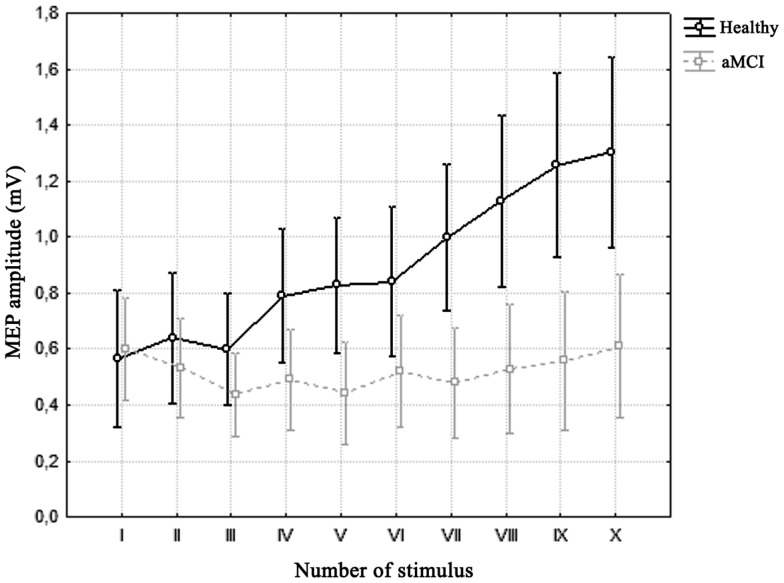
Figure 2.
Average motor-evoked potential (MEP) amplitude across trains of 5 Hz-rTMS in the two groups. Vertical bars denote 0.95 confidence intervals. Repeated measures ANOVA showed a significant interaction of factors “Number of Stimulus” (x-axis) and “Group” (healthy vs. aMCI). Bonferroni’s correction revealed that while there was no significant difference across stimuli in the MCI group, there was a significant increase in MEP amplitude in healthy controls from the seventh stimulus onward.

