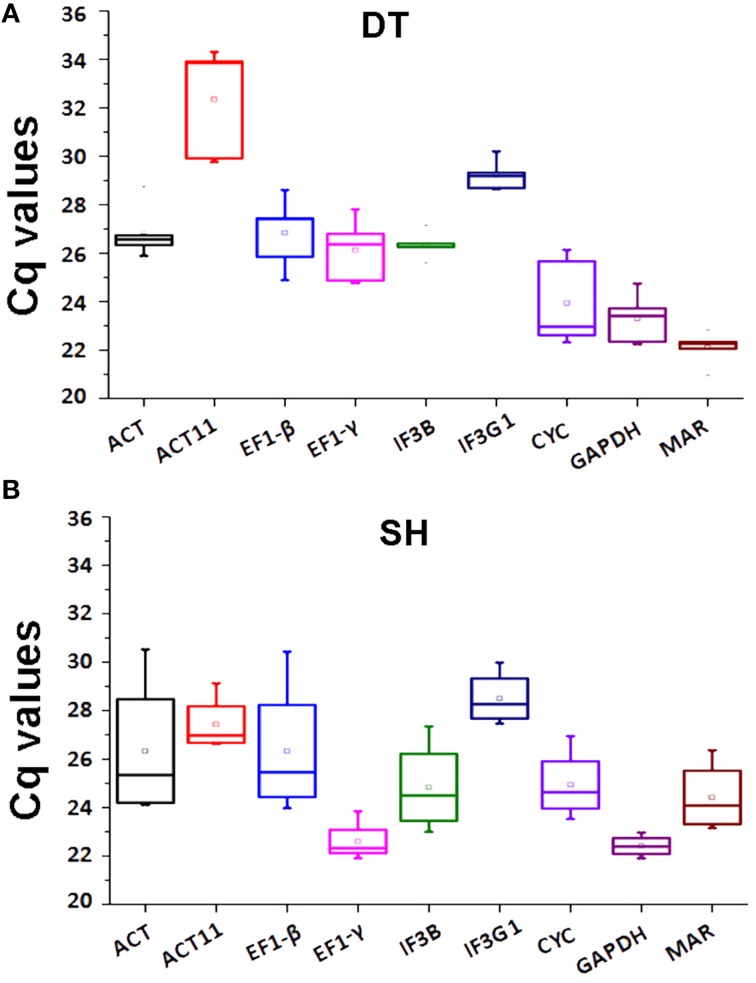
Figure 2.
Expression levels of eight candidate reference genes and MAR in DT or SH. Box-plot graphs of Ct-values for each gene in DT (A) or SH (B) are shown. The plots highlight the mean (hollow square), median (center line), maximum and minimum (whiskers, the vertical lines), and 25 and 75% percentiles (boxes) of the data. The outliers are marked with dots. DT, different tissue sample group; SH, heat-treated seedling sample group.

