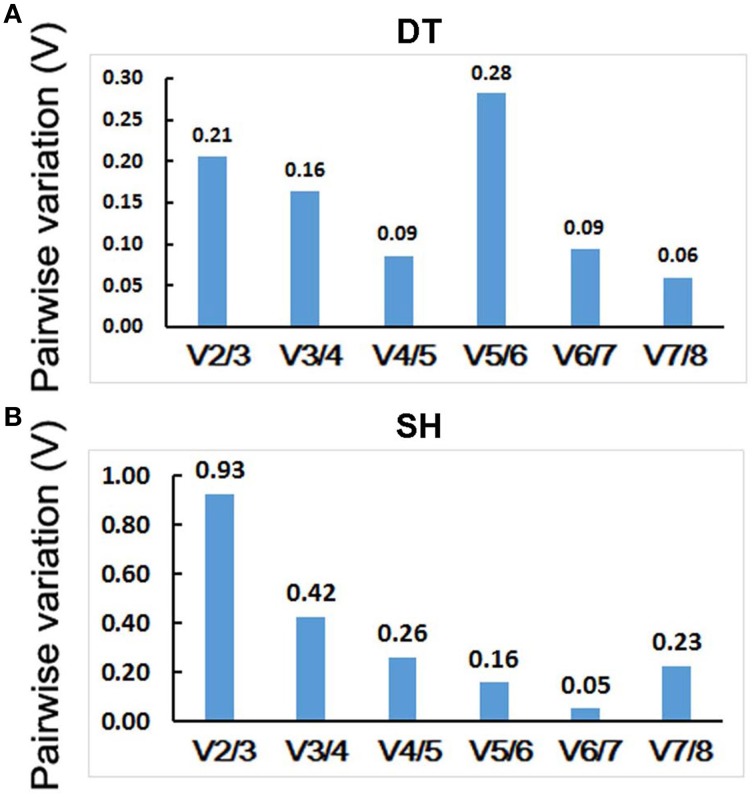
Figure 5.
Determination of the optimal number of internal control genes in DT (A) and SH (B). Pairwise variation (V) values were calculated by geNorm. No additional genes are required for the normalization when values below 0.15. DT, different tissue sample group; SH, heat-treated seedling sample group.

