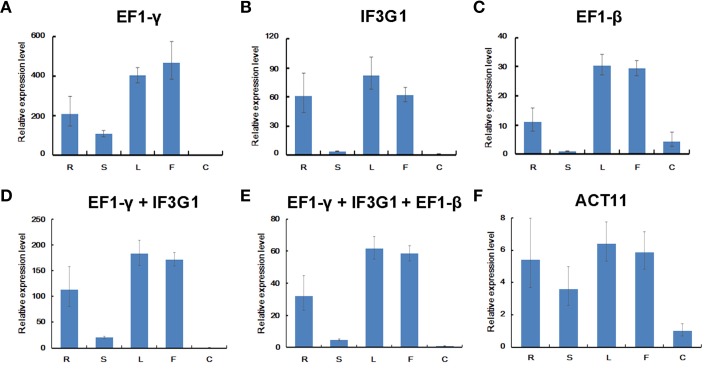
Figure 6.
Relative expression levels of MAR in P. ginseng tissues. Different normalization factors were used: one of the three top ranked genes defined by RefFinder (A–C), the combination of the two (D) or three (E) top ranked genes, and the worst stable gene (F). All values are means ± SD (n = 3). R, root; S, stem; F, flower; L, leaf; C, embryogenic calli.

