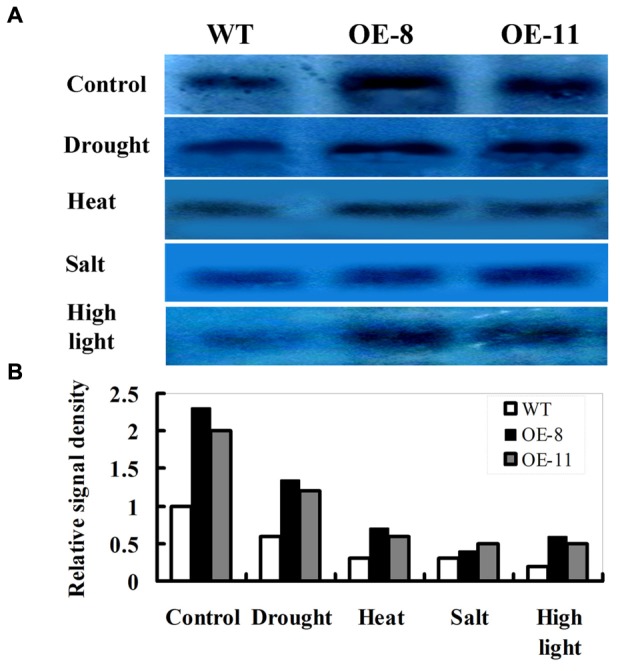
FIGURE 2.

Responses of D1 protein abundance to drought, heat, salt, or high light stress in ZmpsbA OE lines by immunoblot analysis. (A) D1 protein abundance in 3-week-old WT and OE plants under drought (20% PEG-8000 for 12 h), heat (42°C for 3 h), salt (250 mM NaCl for 12 h) or high light (1200 μmol m-2 s-1 for 1 h) conditions. (B) Relative signal density of D1protein abundance in WT and OE lines under above stress conditions.
