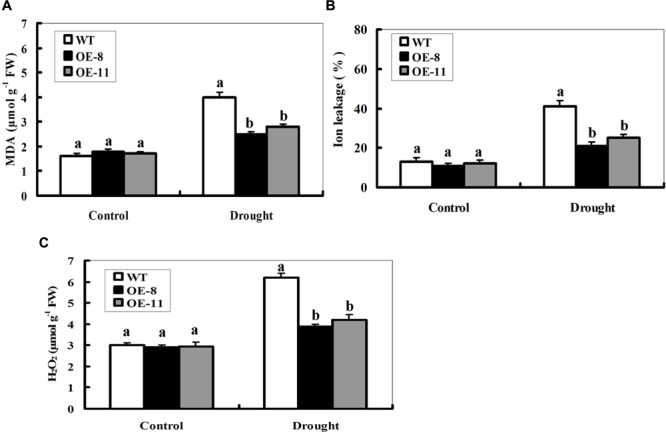
FIGURE 4.

Changes of MDA, lon leakage, and H2O2 in ZmpsbA-transgenic lines under drought stress. (A) Determination of MDA accumulation in leaves of WT and both OE lines (OE-8 and OE-11) after 7-day drought stress. (B) Determination of ion leakage (IL) in leaves of WT and both OE lines (OE-8 and OE-11) after 7-day drought stress. (C) Quantitative determination of H2O2 accumulation in leaves of WT andboth OE lines (OE-8 and OE-11) after 7-day drought stress. In (A–C), each experiment was repeated three times. Bar indicates SE. Different letters indicate significant differences between wild-type and OE lines (ANOVA; P < 0.05).
