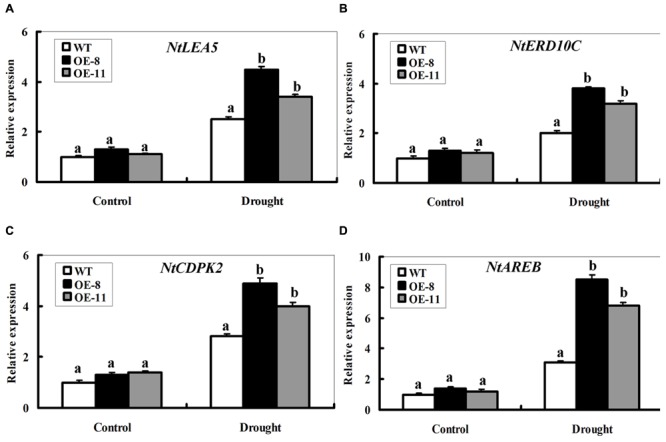
FIGURE 7.

Expression profiles of four stress-responsive genes in WT and ZmpsbA- transgenic lines during drought stress. RNA was extracted from leaves sampled after 7 days of well-watering and drought stress and reverse-transcribed to synthesize cDNA, which was used for quantitative real-time PCR analysis with primers specific for four stress-responsive genes NtLEA5 (A), NtERD10C (B), NtCDPK2 (C), and NtAREB (D). mRNA levels of these genes were normalized to the transcripts of Actin2 in the same samples. For each assay, the expression level of WT under control conditions was taken as 1.0, and data represented mean ± SE of three biological replicates. Bar indicates SE. Significant differences between wild-type and OE lines are indicated by different letters (ANOVA; P < 0.05).
