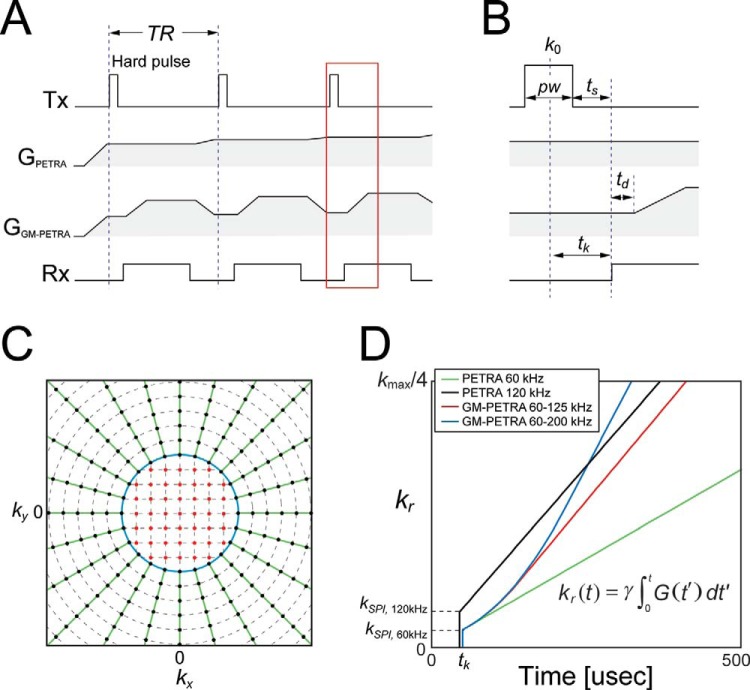
Figure 1.
(A) Sequence diagram of PETRA with and without GM and magnification of the region around excitation shown by a red box (B). GM-PETRA is identical to PETRA until gradients start ramping up. (C) k-space sampling in PETRA and GM-PETRA is a hybrid of 2 sampling strategies. The center region is sampled with SPI (red points) and the peripheral region by radial readout (green lines). The boundary of the 2 sampling regions (kSPI) is limited by tk = pw/2 + ts (kSPI = γGex · tk; blue circle). (D) GM-PETRA samples k-space more quickly by increasing the gradient amplitude after excitation. Although PETRA sampling with a high bandwidth (120 kHz) achieves faster sampling around the k-space center, GM-PETRA with lower excitation bandwidth (Gex = 60 kHz) catches up on it quickly as the gradient modulation increases (Gmax= 125 and 200 kHz).

