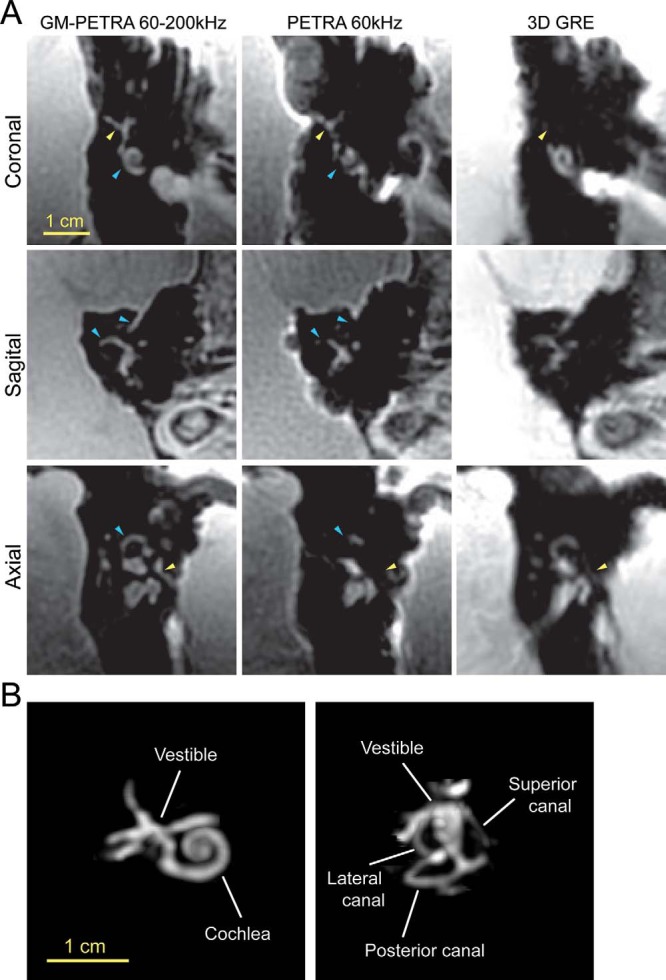
Figure 4.

(A) In vivo imaging of a healthy volunteer's inner ear. Complex structures in the inner ear were well visualized with GM-PETRA compared to PETRA and 3D GRE. PETRA had a high sensitivity to short T2* signals that was comparable to GM-PETRA but suffered from severe image blurring (ie, missing structures) because of strong susceptibility differences at the air-tissue interfaces (light blue arrowheads). The strong susceptibility differences accelerated the T2* signal decay, making it difficult to visualize some structures of the inner ear (eg, small nerves) with 3D GRE (yellow arrowheads). (B) MIP images calculated for GM-PETRA by masking out the surrounding tissues around the inner ear. The MIP images allowed complex structures in the inner ear to be visualized. MIP images projected to different image planes are available in the online Supplemental Materials.
