FIGURE 1.

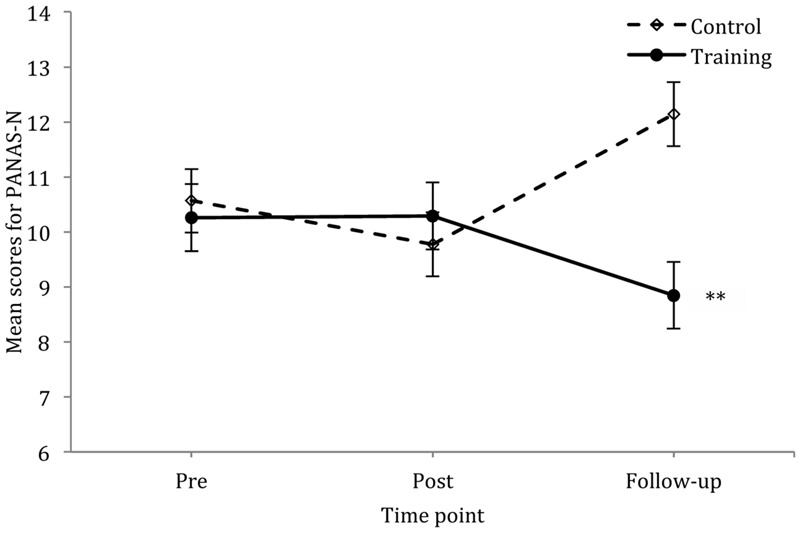
Mean scores for PANAS-N across three time points for the control and training group; vertical lines depict standard errors of the means. ∗∗p < 0.01.

Mean scores for PANAS-N across three time points for the control and training group; vertical lines depict standard errors of the means. ∗∗p < 0.01.