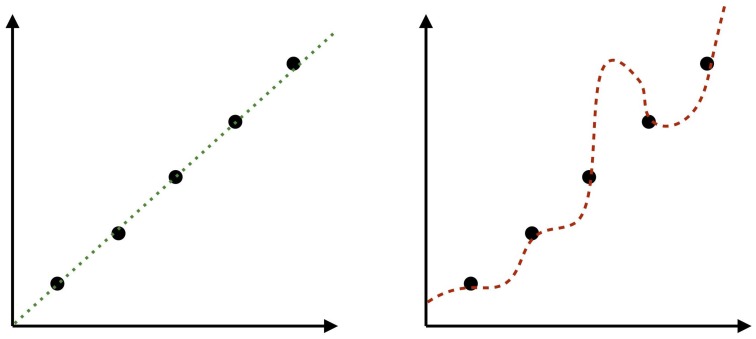
Figure 2.
There are an infinite set of possible functions interpolating from seen points to unseen points in these graphs. Our intuition is that the linear function on the left represents a more reasonable hypothesis than the one on the right, despite the fact that both fit the data perfectly well. In other words, we have prior expectations about what functions are more likely than others. In this case, the prior includes a preference for linearity (cf. Kalish et al., 2007).

