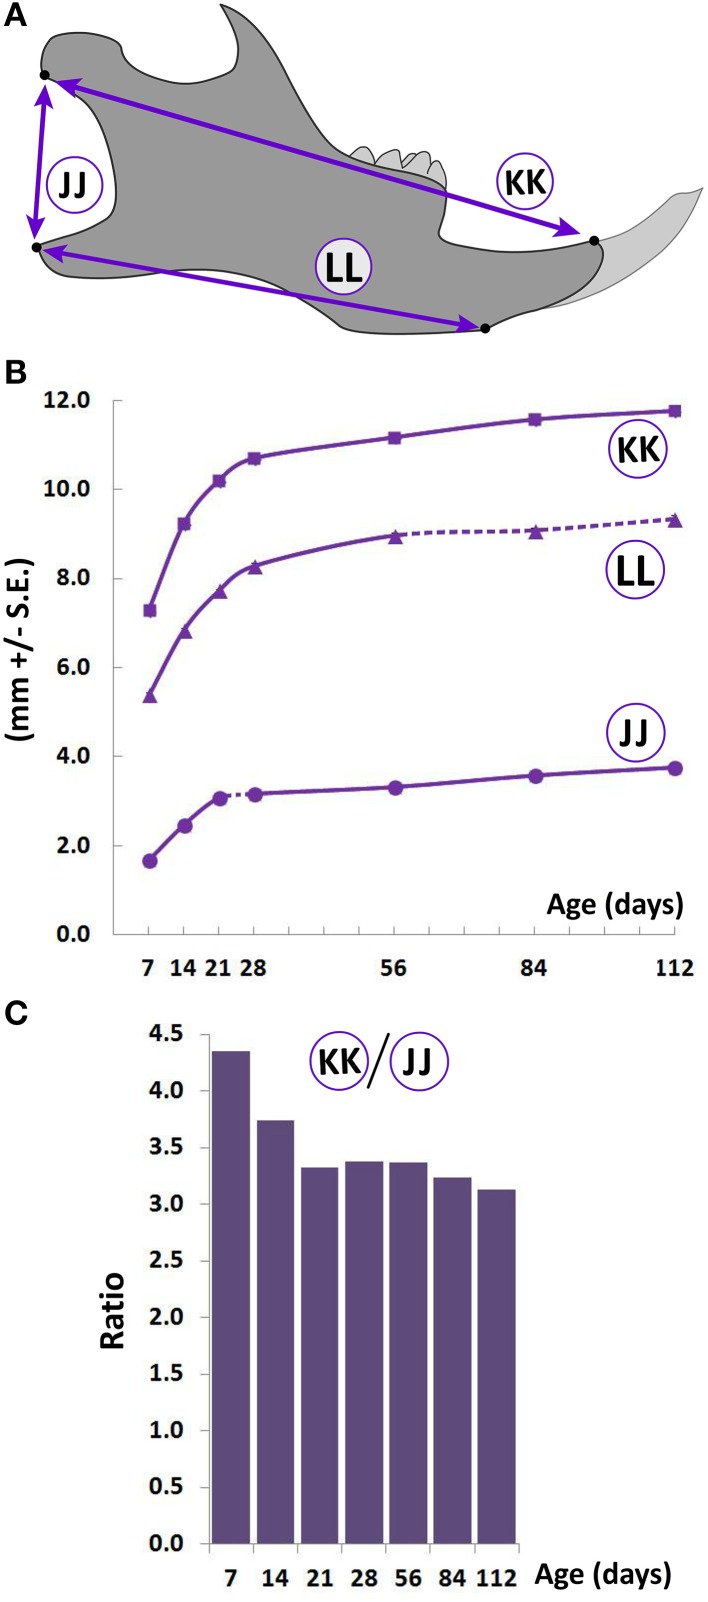
Figure 4.
Postnatal growth of the lower jaw. (A) Schematic of the lateral view of the mouse hemimandible (right) depicting landmarks (black dots) used to obtain measurements. (B) Growth curves showing changes in vertical and A-P measurements (mm ± S.E., y-axis) with age (postnatal day, x-axis). The label adjacent to each curve is depicted in the schematic (see Table 1 for description). Solid and dashed lines between data points represent significant and non-significant changes, respectively, for that interval (Students' t-test, p < 0.05). (C) Postnatal change in ratio (y-axis) of the A-P (length, circled KK), and vertical (height, circled JJ) mandibular measurements with age (postnatal day, x-axis).

