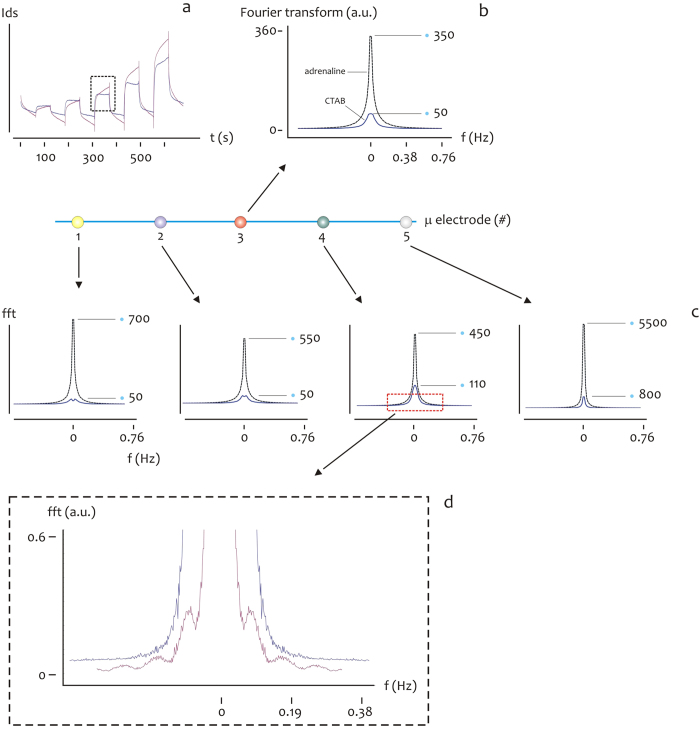
Figure 6. The characteristic time behavior of CTAB and adrenaline and the difference between these may be ascribed to the different size and thus motility of the considered species in a solution, and is reflected by the Fourier transform of the time signal of CTAB compared to adrenaline.
The square of the real part of the Fourier transform of CTAB and adrenaline (b) is reported, derived from the time-continuous signal of the two species for time interval 300–380 s, for a fixed Vgs = 0.8 V (a). The Fourier transform of adrenaline express peaks (maximum fft amplitudes) that are higher than those displayed by CTAB, for all the considered points in the device, that is, from #1 to #5 (c). On magnifying the small frequencies region as in in (d,e) one may also observe that the Fourier profile of CTAB is more rough and discontinuous compared to adrenaline.

