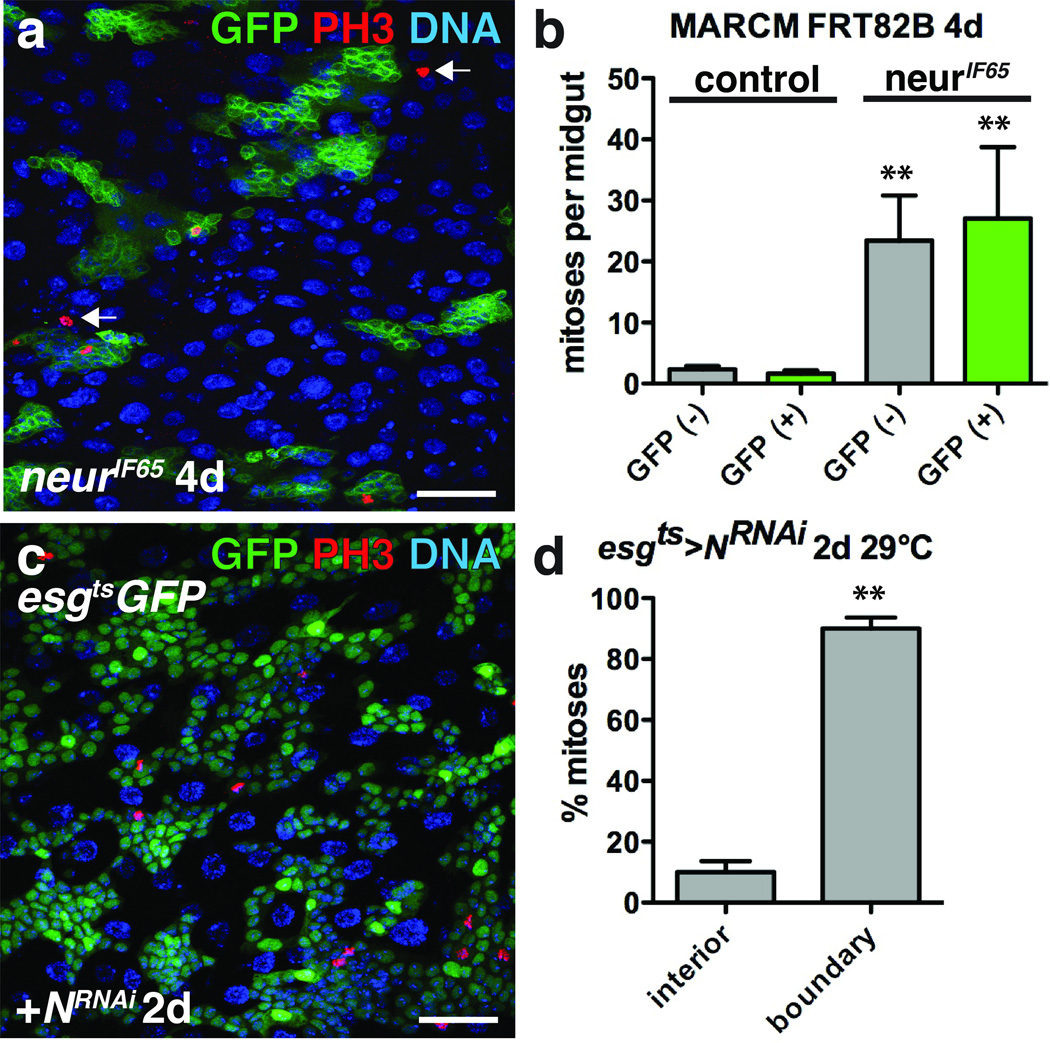
Figure 5. ISC tumor growth induces non-autonomous ISC proliferation.
(a) Phosphorylated histone H3 Ser10 (red) inside and outside (arrows) of 4 day neurIF65 clones (green).
(b) Mean number with s.e.m. of mitoses per midgut found inside (GFP+, green; for neur− clone, Mann-Whitney: p=0.0011) and outside (GFP–, grey; for neur− clone, Mann-Whitney: p=0.0012) of 4 day control (n=31 midguts) or neurIF65/− clones (n=24 midguts). Midguts were pooled from 3 independent experiments.
(c) Phosphorylated histone H3 Ser10 (red) in midguts expressing GFP (green) and NRNAi with esgts for 2 days.
(d) Mean percent of phosphorylated histone H3 Ser10 positive cells with s.e.m. found in the tumor interior or at the tumor boundary (n=3 fields; fields were selected from 3 posterior midguts from 2 independent experiments, paired t-test: p= 0.0080) in flies expressing GFP and NRNAi with esgts for 2 days.
DNA in a, c (blue). Scale bar in a, 40 µm; c, 35 µm.

