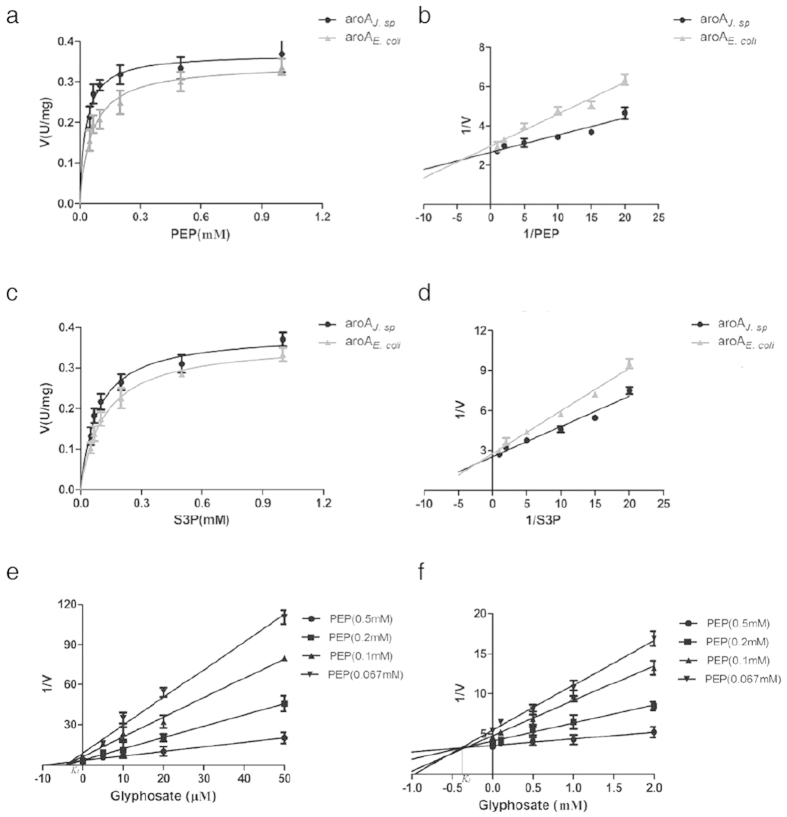
Figure 3.
(a) The V-S curve of aroAJ. sp and aroAE. coli assayed at fixed S3P and various PEP concentrations. (b) The Lineweaver-Burk plots aroAJ. sp and aroAE. coli assayed at fixed S3P and various PEP concentrations. (c) The V-S curve of aroAJ. sp and aroAE. coli assayed at fixed PEP and various S3P concentrations. (d) The Lineweaver-Burk plots aroAJ. sp and aroAE. coli assayed at fixed PEP and various S3P concentrations. (e) The Ki values of aroAE. coli determined by lines converging on the x-axis of Lineweaver-Burk plots. (f) The Ki values of aroAJ. sp determined by lines converging on the x-axis of Lineweaver-Burk plots.

