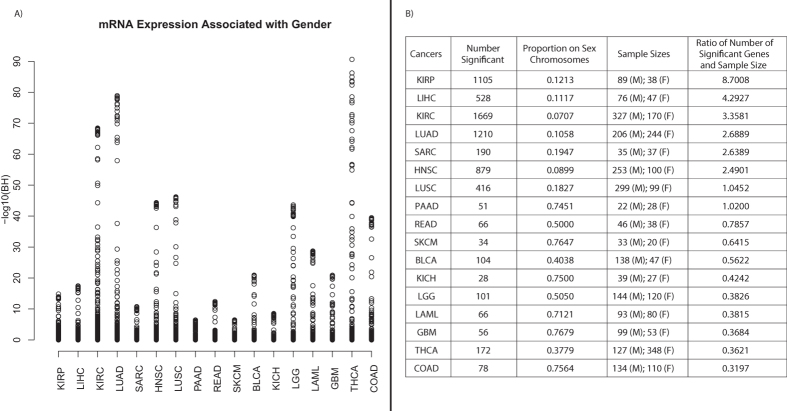
Figure 2. Tumor differential expression analysis with respect to sex.
(A) Plot of all BH-values for genes in each of the 17 cancers. The cancers are listed in decreasing order of the ratio of number of identified significant genes to sample size on the x-axis. (B) Table of number of significant genes, sample size, and ratio of number of significant genes to sample size. The table includes entries for each of the 17 cancers.

