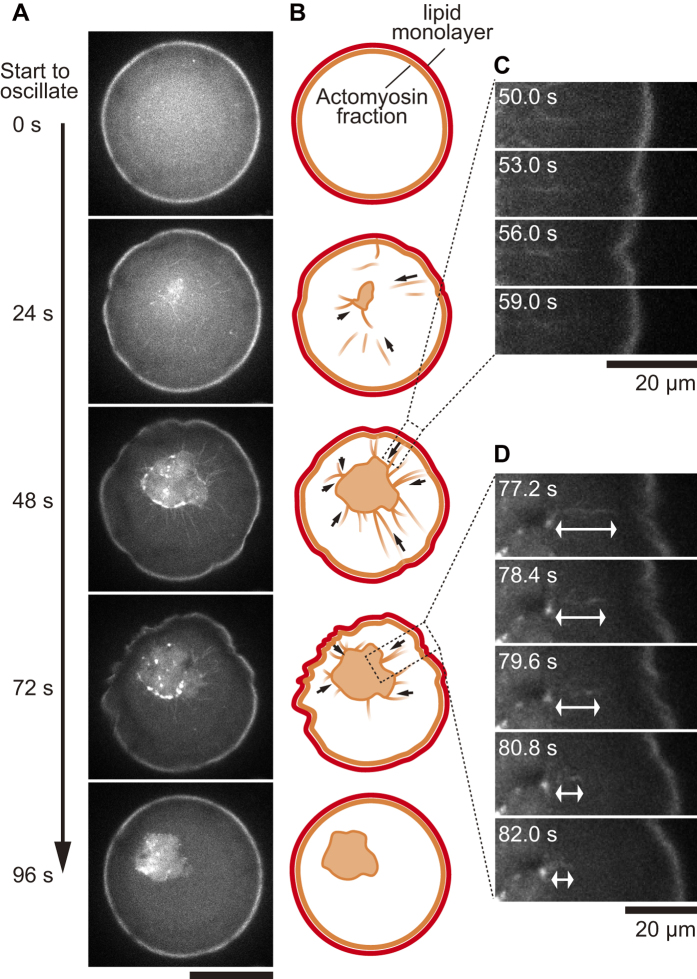
Figure 2. Actin distribution during the non-periodic oscillatory deformation.
(A) Confocal fluorescence images of the interfacial oscillatory deformation. Actin filaments (fluorescently-labeled) spontaneously form an aster-like structure and pull the lipid interface. Scale bar is 50 μm. (B) Schematic illustrations corresponding to the confocal images shown in (A) Red and orange colors denote the lipid interface and actomyosin fraction (fluorescently-labeled in A), respectively. The arrows indicate the inward direction of bundle motion. (C) Magnified images of the region enclosed with the connected dashed line in which an actin bundle pulls and distorts the interface. The rectangular images were rotated to put horizontally. Scale bar is 20 μm. (D) Magnified images of a region in which the core pulls an actin bundle toward the center of the droplet, leading to the formation of the aster-like structure. The white arrow indicates the length of the actin bundle in the aqueous bulk. Scale bar is 20 μm.

