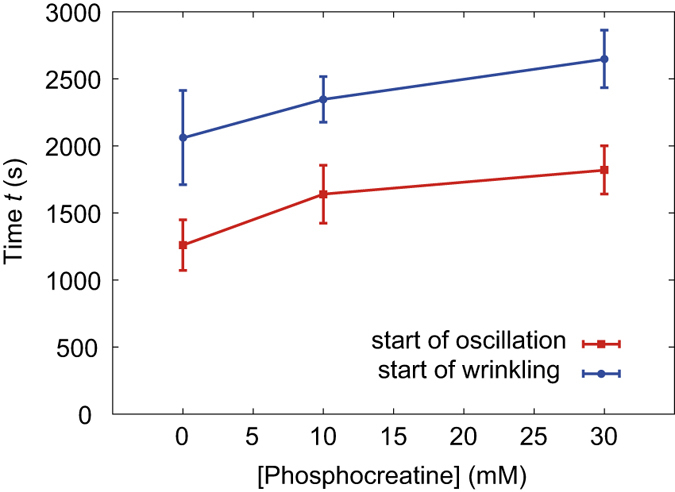
Figure 4. Phosphocreatine-concentration dependence of the onset time of the deformation.

Squares (red): the onset time of the non-periodic oscillatory deformation; circles (blue): the onset time of the wrinkle development. Error bars represent the standard error of the mean (n = 5 for each phosphocreatine concentration).
