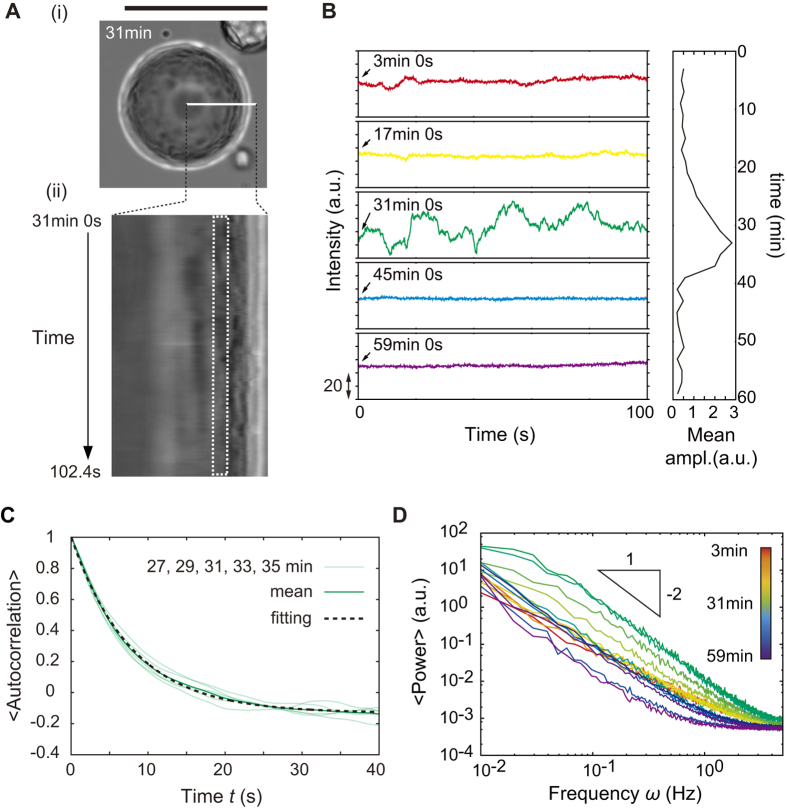
Figure 5. Characterization of the time correlation of the dynamic non-periodic oscillation.
(A) Example of the time course of the intensity oscillation during the non-periodic oscillatory deformation. (i) Transmitted light images of the droplet at 31 min from the droplet preparation. Scale bar is 50 μm. (ii) Spatiotemporal map of a magnified region indicated in (i) by the radial white line. The white broken box in (ii) corresponds to the region in-focus, which were analysed. (B) (left) Time course of the intensity at various time points ranging from 3 min to 59 min. (right) Mean amplitude of the oscillation profiles exemplified in the left graphs. Time-dependent oscillation occurred only around 30 min. (C) Autocorrelation of the oscillatory deformation around 30 min (27, 29, 31, 33, 35 min, and the mean of them). The broken line is the result of exponential fitting of the mean. (D) Temporal variation in power spectra. There is no peak for the broad frequency domain ω = 0.01–5 s−1, indicating the temporal oscillatory deformation is non-periodic.

