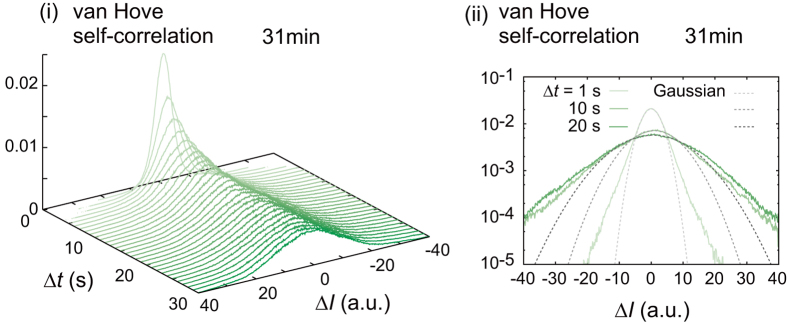
Figure 6. The van Hove self-correlation function obtained for the oscillatory deformation.
(ii) The tails of the distributions are almost linear in single logarithmic plots, i.e., exponential distributions. Gray broken lines are Gaussian distributions corresponding to the green lines with the same brightness. All fittings were conducted around the peaks of the experimental distributions.

