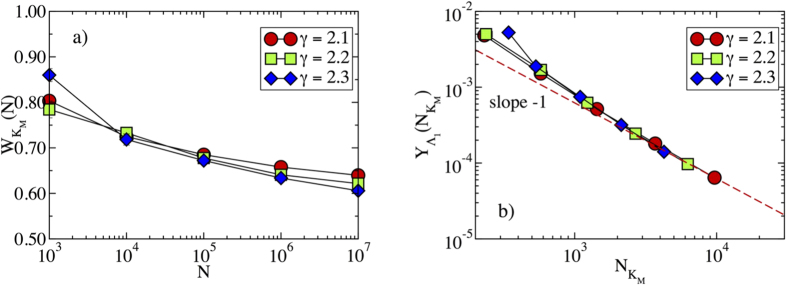
Figure 3.
(a) Total weight  of the PEV on the nodes of the max K-core in synthetic networks as a function of size N. (b) Inverse participation ratio as a function of the size of the max K-core
  . The dashed line represents a power-law behavior
  . We can see the asymptotic behavior
  , valid for large network sizes.

