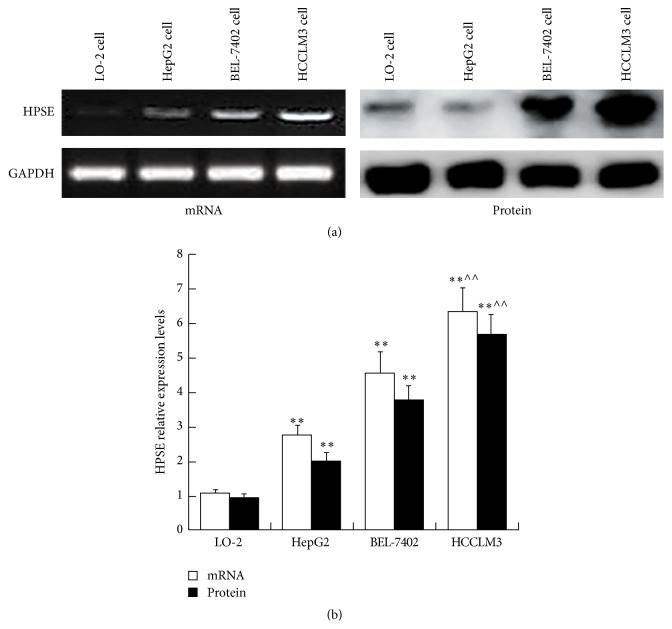
Figure 1.
HPSE mRNA and protein expressions in HCC cells. (a) Expressions of HPSE in HCC cells were determined via RT-PCR and Western blot analysis. (b) HPSE mRNA and protein relative expression levels in HCC cells. Data presented means ± SD. ∗∗ P < 0.01 compared with that in LO-2 cell; ∧∧ P < 0.01 compared with that in HepG2 cell.

