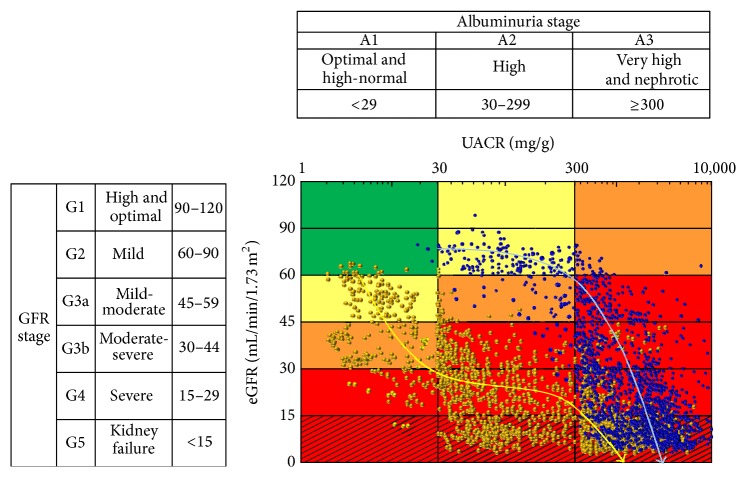
Figure 3.
Data of simultaneously measured eGFR and UACR from the first visit to RRT initiation in the diabetic nephropathy group and nephrosclerosis group as represented on the KDIGO heat map. Blue and yellow bold arrows indicate clinical trajectories of the diabetic nephropathy and nephrosclerosis groups, respectively. eGFR, estimated glomerular filtration rate; GFR, glomerular filtration rate; KDIGO, Kidney Disease: Improving Global Outcomes; UACR, urinary albumin to creatinine ratio.

